
We are thrilled to introduce flotools v2.5, designed to transform your pipeline and wellhead management with cutting-edge tools and enhanced functionalities. This release brings substantial advancements to streamline your processes, reduce complexity, and enhance productivity. Let’s delve into the highlights of this transformative update.
Pipeline Builder
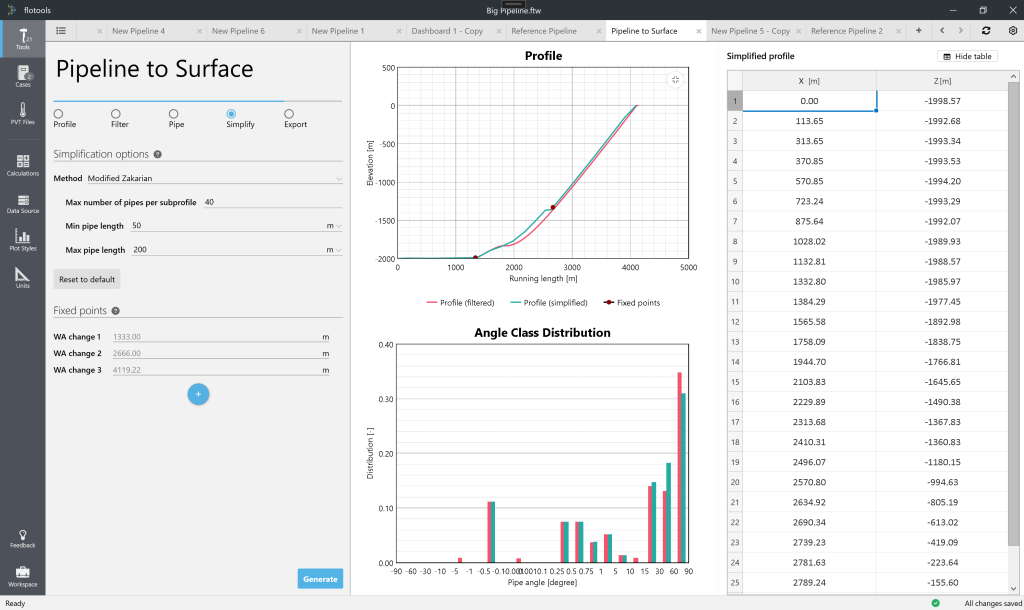
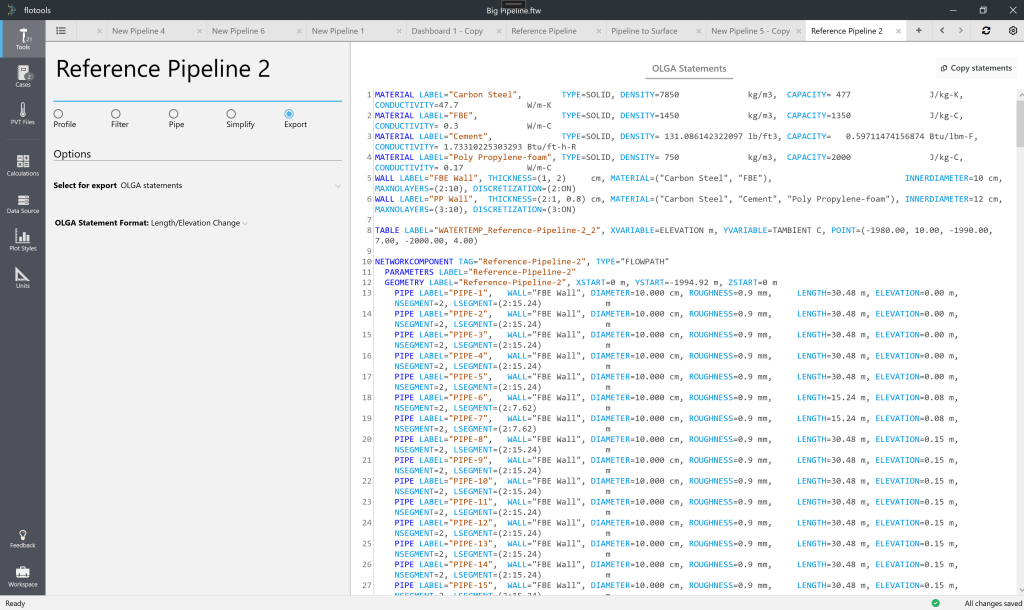
The new Pipeline Builder Tool in flotools v2.5 greatly simplifies the task of going from raw bathymetry / elevation profile data to an optimized OLGA network component. With the ability to filter, simplify, or discretize elevation profiles, you can create the best possible pipeline model, while eliminating the time and effort needed for manual calculations.
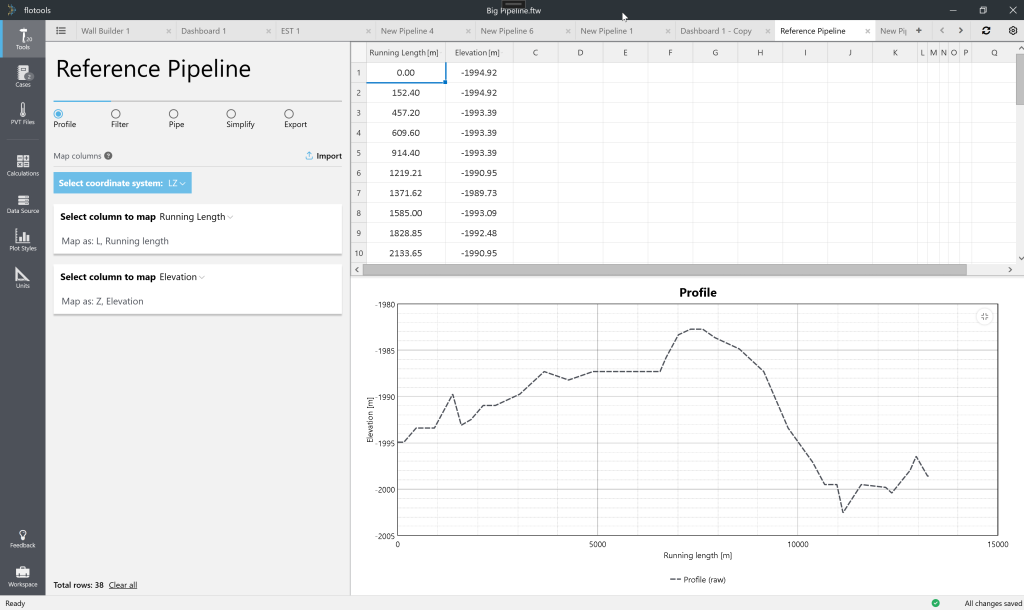
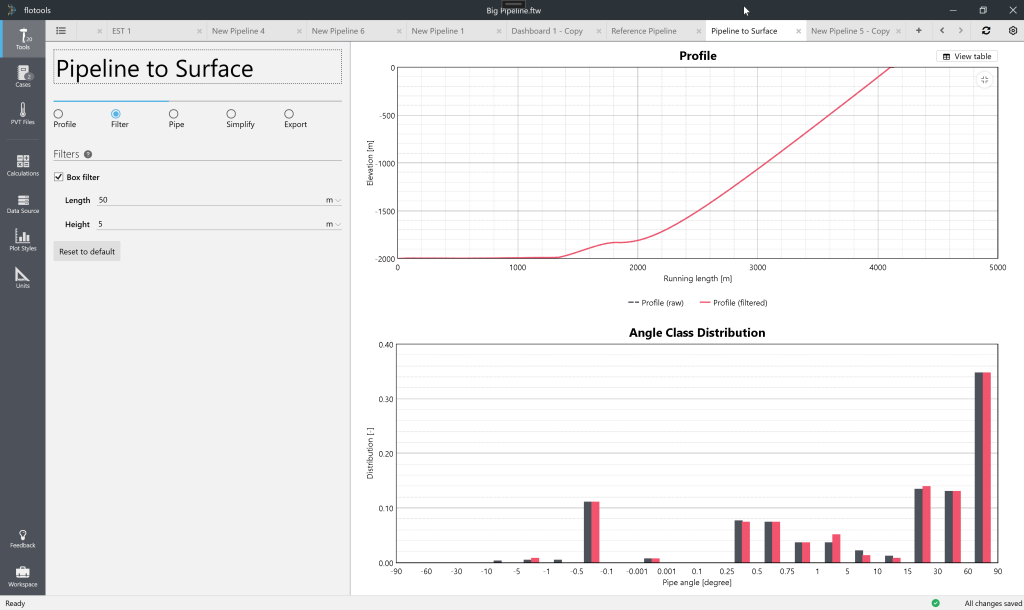
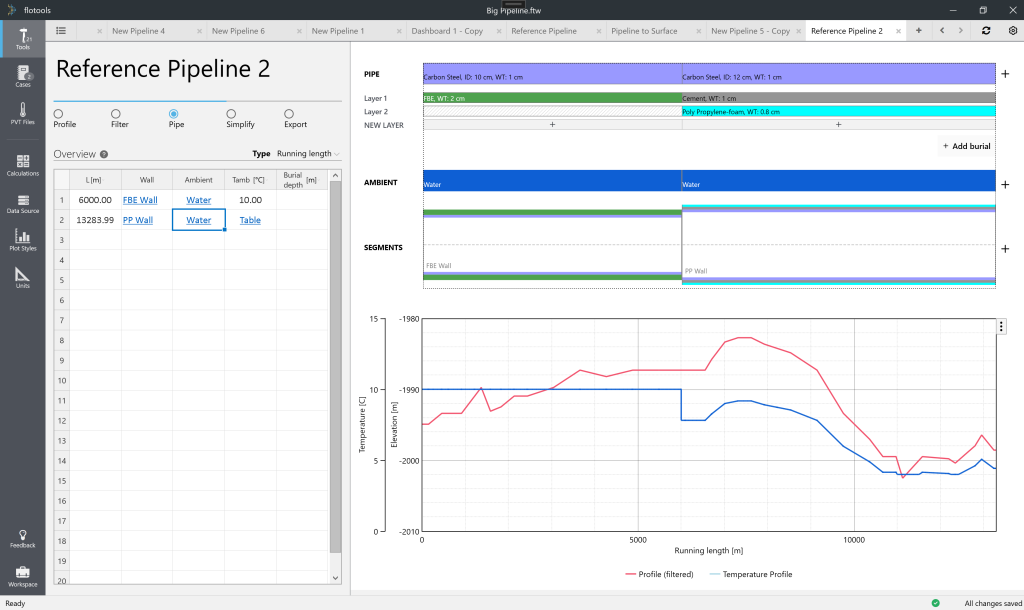
Additionally, the tool greatly simplifies the task of defining multi-layer pipe walls across the pipeline, providing the flexibility to tailor designs to specific project needs. By enabling the specification of burial and ambient conditions along the pipeline, you can ensure that all environmental factors are thoroughly integrated into your pipe discretization. The advanced plotting capabilities allow you to visualize critical values such as elevation profiles, angle class distribution, ambient temperatures, and U-Values, enhancing your ability to make informed decisions. When you’re done, flotools can generate OLGA statements for materials, walls, ambient tables, and the OLGA branch, streamlining your workflow and reducing the potential for errors.
Well-head Shut-in Pressure Calculator
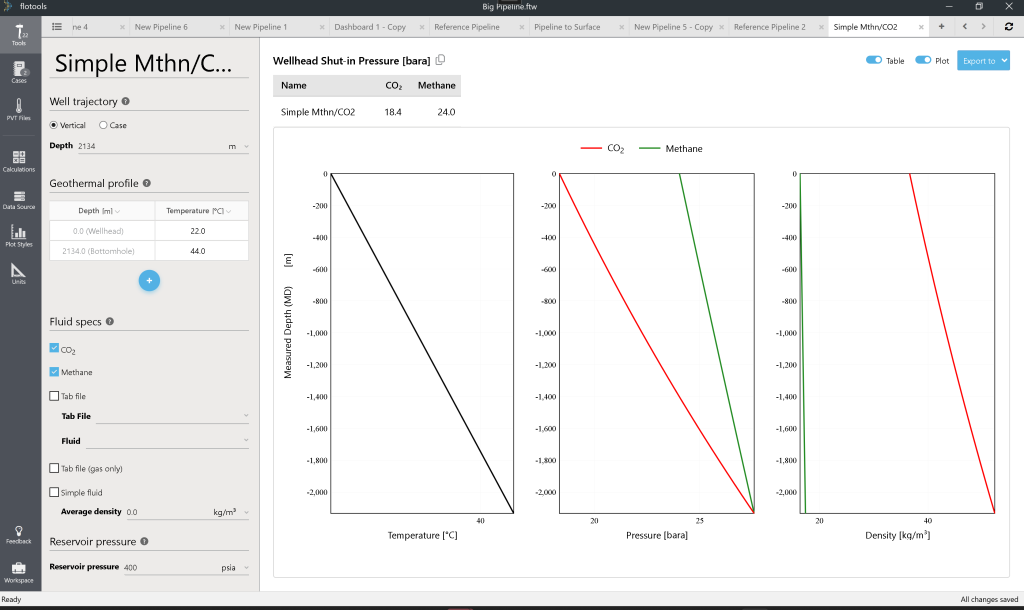
The Wellhead Shut-In Pressure Tool simplifies the calculation of wellhead shut-in pressure, providing you with crucial insights for well design. Whether you are calculating using a well branch from OLGA or a straight wellbore, this tool offers flexibility to accommodate diverse scenarios. By integrating a geothermal profile, you can achieve precise calculations that reflect real-world conditions. The tool supports various fluids, including methane, CO2, simple fluids with average density, TAB file fluids, and gas fluids in TAB files, making it versatile for different project requirements. You can specify reservoir pressure to ensure the accuracy of shut-in pressure calculations, and the tool’s comprehensive charts—covering TVD/Horizontal wellbore, temperature, pressure, and density—provide a visual representation of the data, aiding in better analysis and decision-making. Final pressures are presented in a table, and chart data can be plotted in the Plotting Dashboard as profiles, ensuring all critical information is easily accessible and actionable.
Plotting Enhancements
Our Plotting Dashboard tool has undergone significant upgrades to enhance its usability and functionality. The addition of an overview pane in the dashboard offers a clear summary of series information for all selected plots, making it easier to manage and analyze your data.
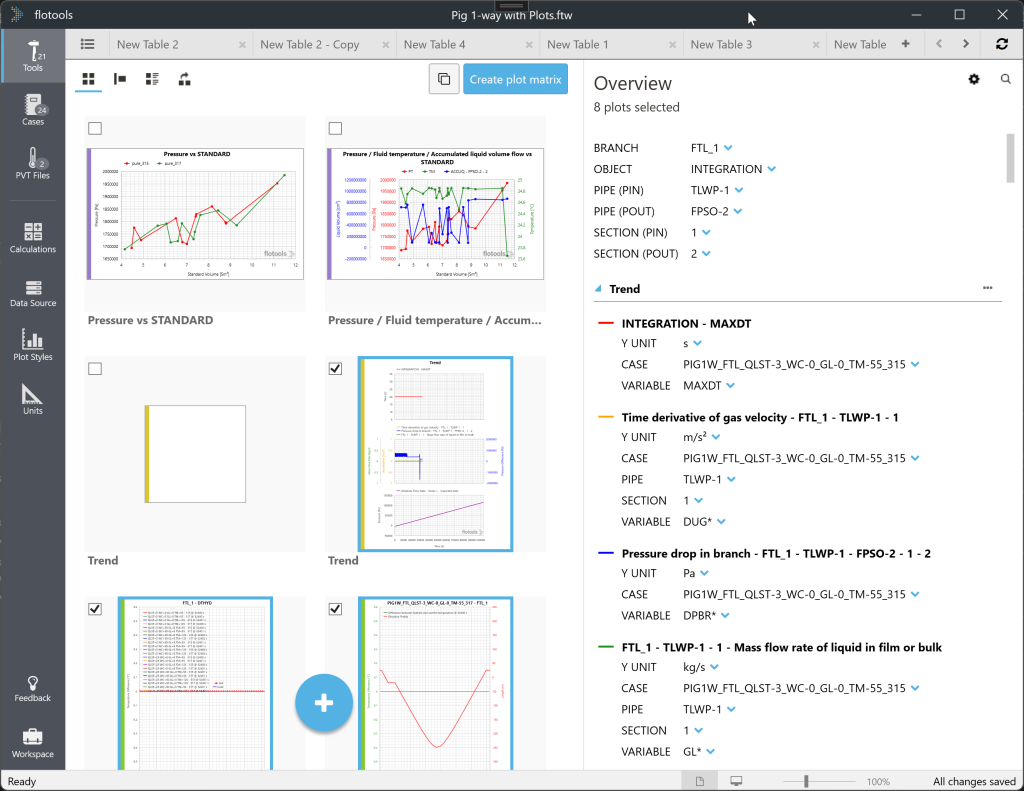
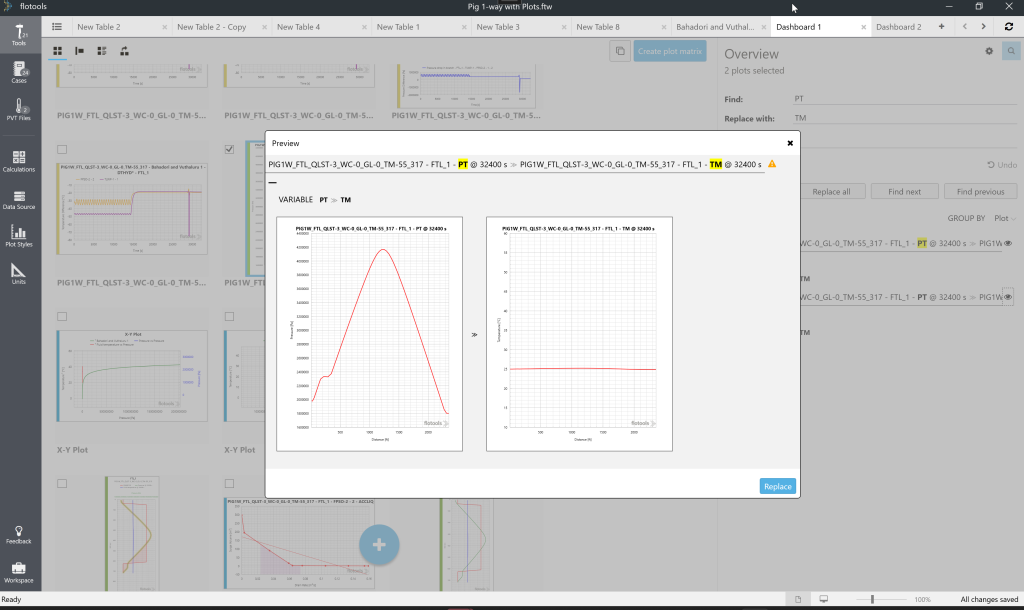
The new search and replace functionality, complete with an undo option, improves the efficiency of data manipulation. The ability to duplicate plots and create plot matrices using dashboard buttons simplifies complex plotting tasks, saving you time and effort. You can now edit plot notes directly in the dashboard view, ensuring that all relevant information is easily accessible.
Support for fraction units for EVR and the addition of the MMBtu/h unit expand the tool’s applicability. Improved initial loading speed of data from OLGA files means less waiting time and more productivity. Several bug fixes, including those related to arrow annotations, “Change All to This” functionality, and Excel export issues, ensure a smoother and more reliable plotting experience. The Plot Matrix feature has been enhanced to provide greater flexibility and functionality. The addition of a cases filter streamlines plot matrix management, making it easier to focus on relevant data. Creating a plot matrix by finding and replacing text within properties allows for more efficient data handling. The ability to zoom in on the plot matrix and export selected plots to a dashboard facilitates detailed analysis and presentation. The capability to create a plot matrix with X-Y plots further diversifies the types of analysis you can perform, enhancing your ability to uncover insights and make data-driven decisions.
Other improvements
Table Builder has been optimized for better performance and usability based on initial user feedback. The addition of column format tools to the ribbon control for multi-column formatting and sorting improves data organization and presentation. Enhancements in Imported Data tool include the ability to change the data in the spreadsheet after the initial load and still synchronize the column mappings, and improvements in detecting absolute time data. General performance and stability improvements across the platform ensure a smoother and more efficient user experience.
flotools v2.5 is designed to elevate your workflow, providing powerful new tools and enhancements that streamline your processes, reduce complexity, and enhance productivity. Update to flotools v2.5 today and experience the transformative difference these new features and improvements can make in your projects.