
flotools 2.4 is full of new and exciting improvements to flotools. We will learn about the two major features here in this article and more detailed tutorials on how to use these features will be coming in later posts.
Table Builder
Table Builder is a brand new tool that allows you to build report-ready tables. Table builder can be used to extract data from parametric studies or from any set of cases. When working with parametric studies, it allows you to pull in varying input parameters as columns and then summarize several output variables against them very quickly.
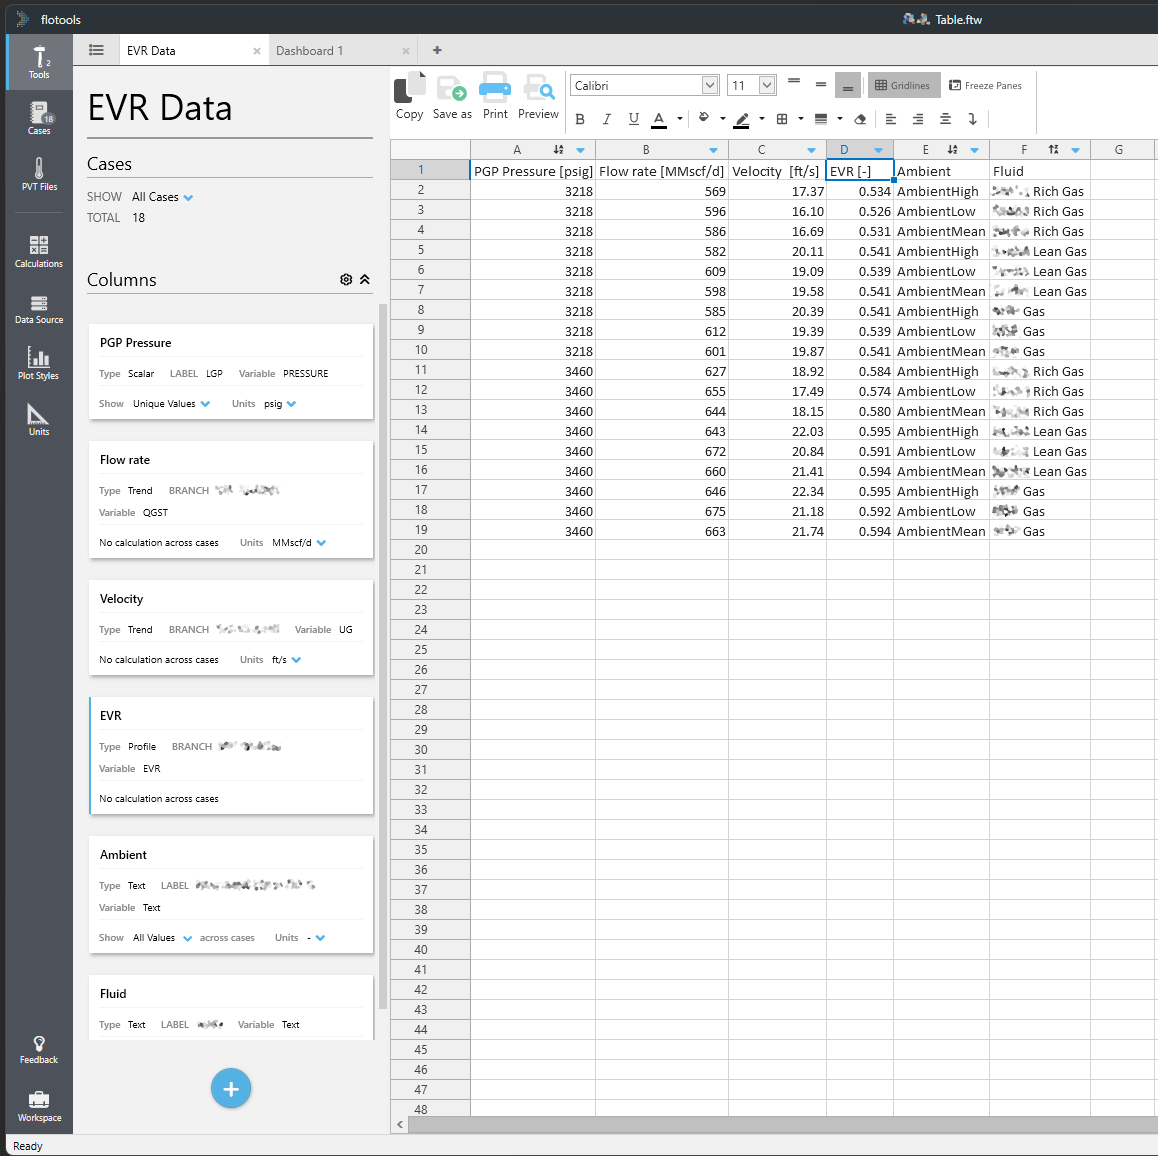
You can think of this is an extension to parametric plots but with the ability to select numerous output variables all at once.
Where it goes beyond parametric plots is in its ability to summarize data across multiple branches, and to summarize data across cases.
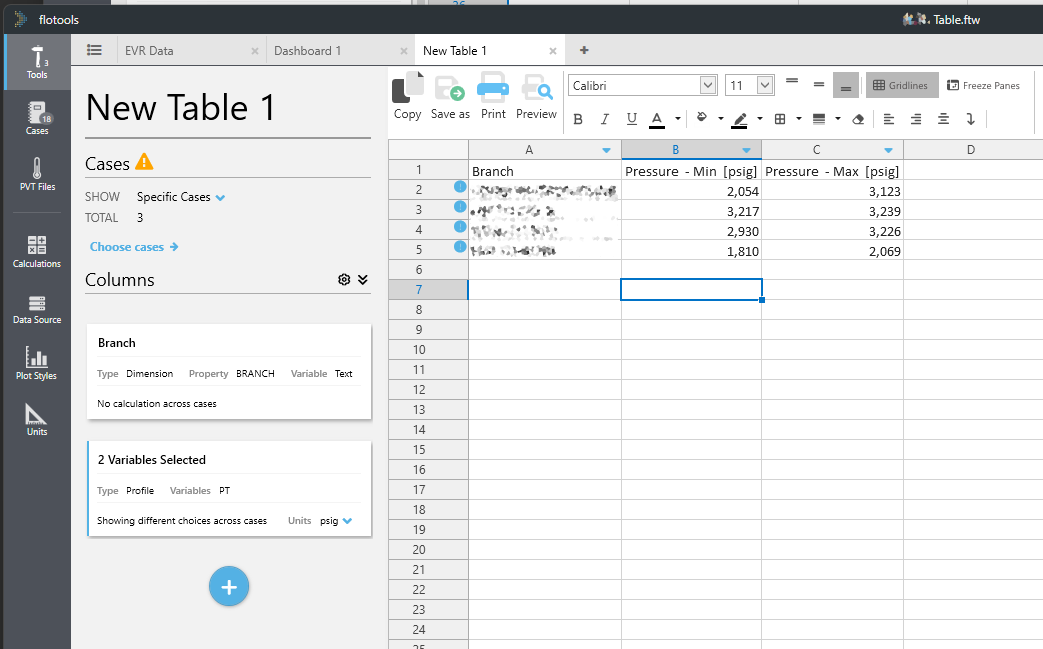
In the example above, you can see 3 cases are selected. The first column is branch and there are 4 different branches in each of these cases. We have chosen the pressure profile variable (PT) for each of these branches and computed the minimum and maximum over the distance at the last simulation point. Not only that, because we have 3 cases, we have further computed the minimum of the minima and maximum of the maxima across the cases. Table Builder allows you to build quick summaries such as this with minimal effort.
Table Builder doesn’t just support BRANCH as a column, but also other devices such as VALVE and CONTROLLER so you can extract data efficiently across similar model components.
Improvements to Parametric Study
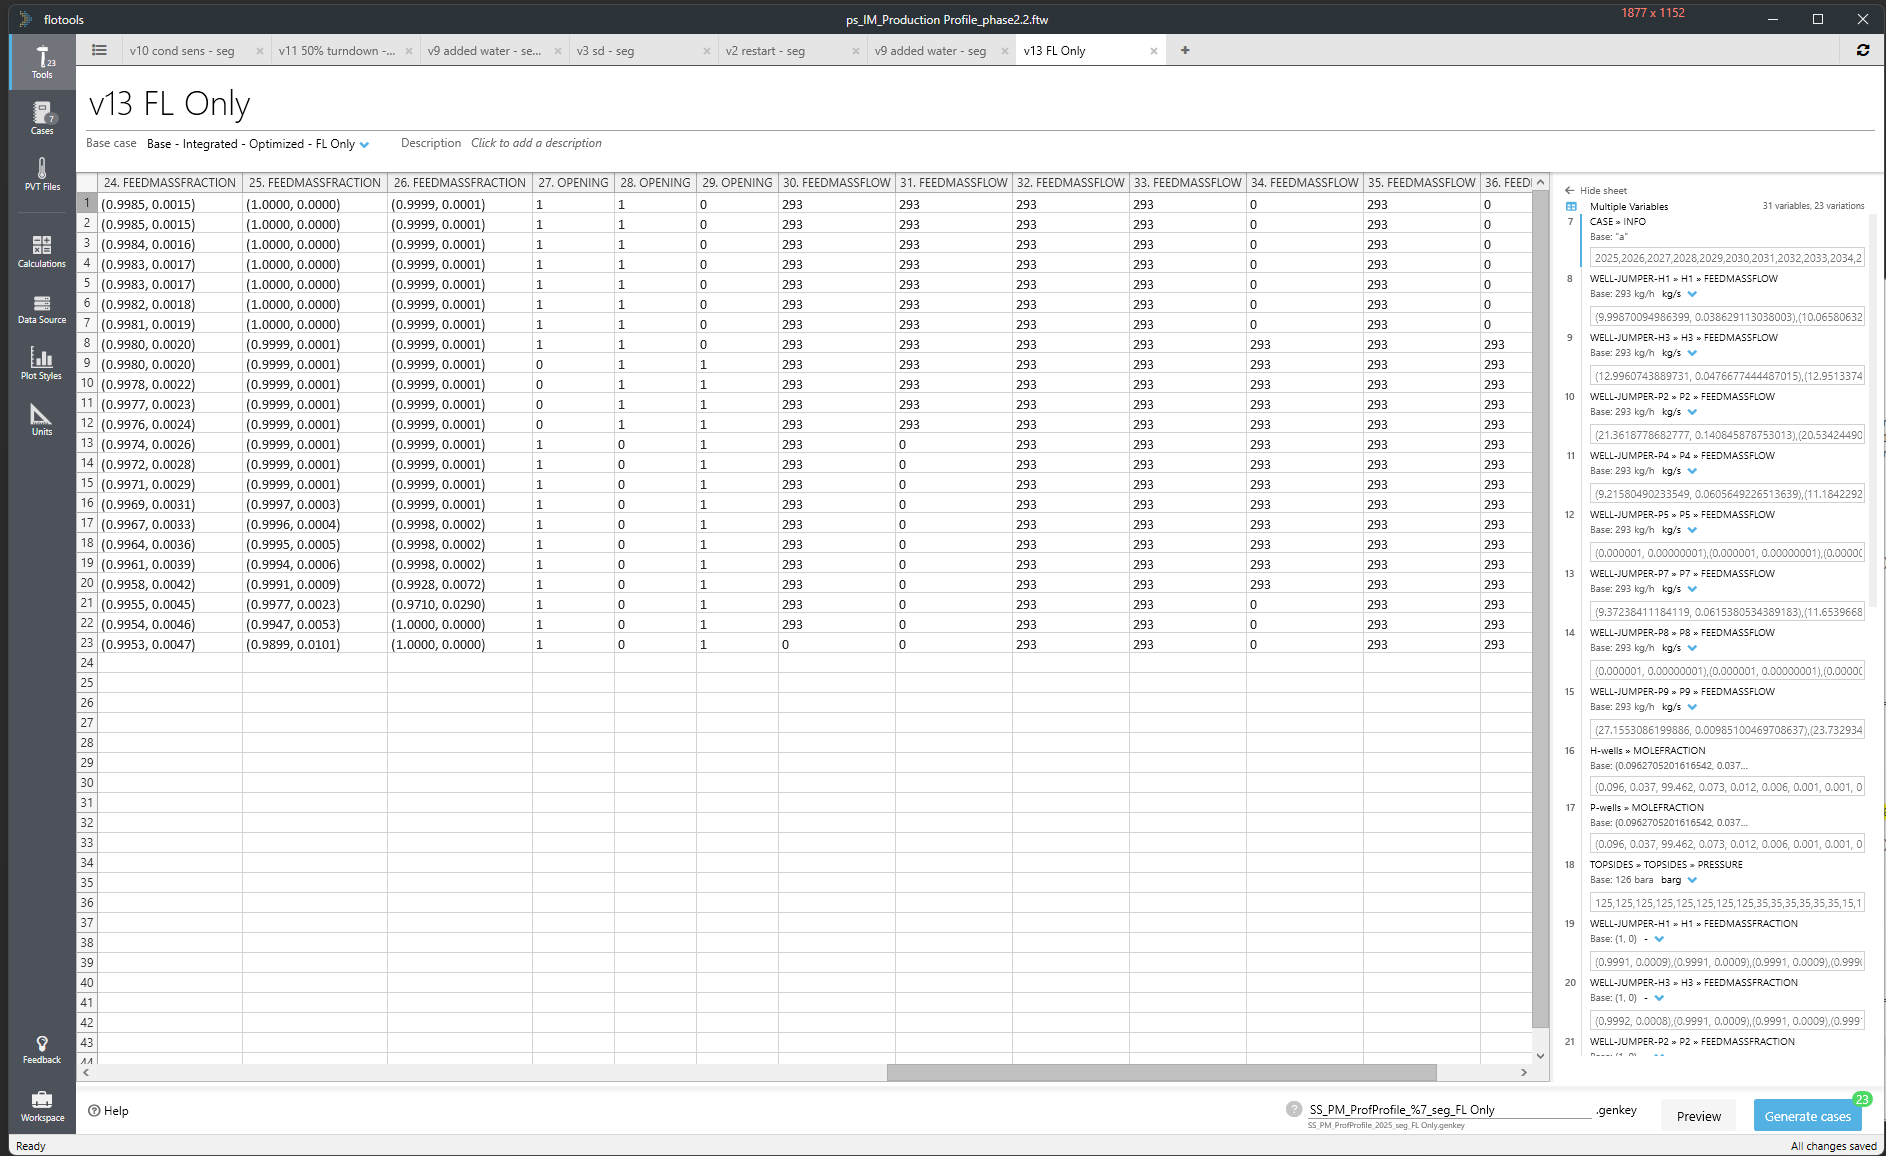
Parametric study got a complete redesign to maximize the use of space and a new feature that allows you to paste in covariant variable data from spreadsheets.
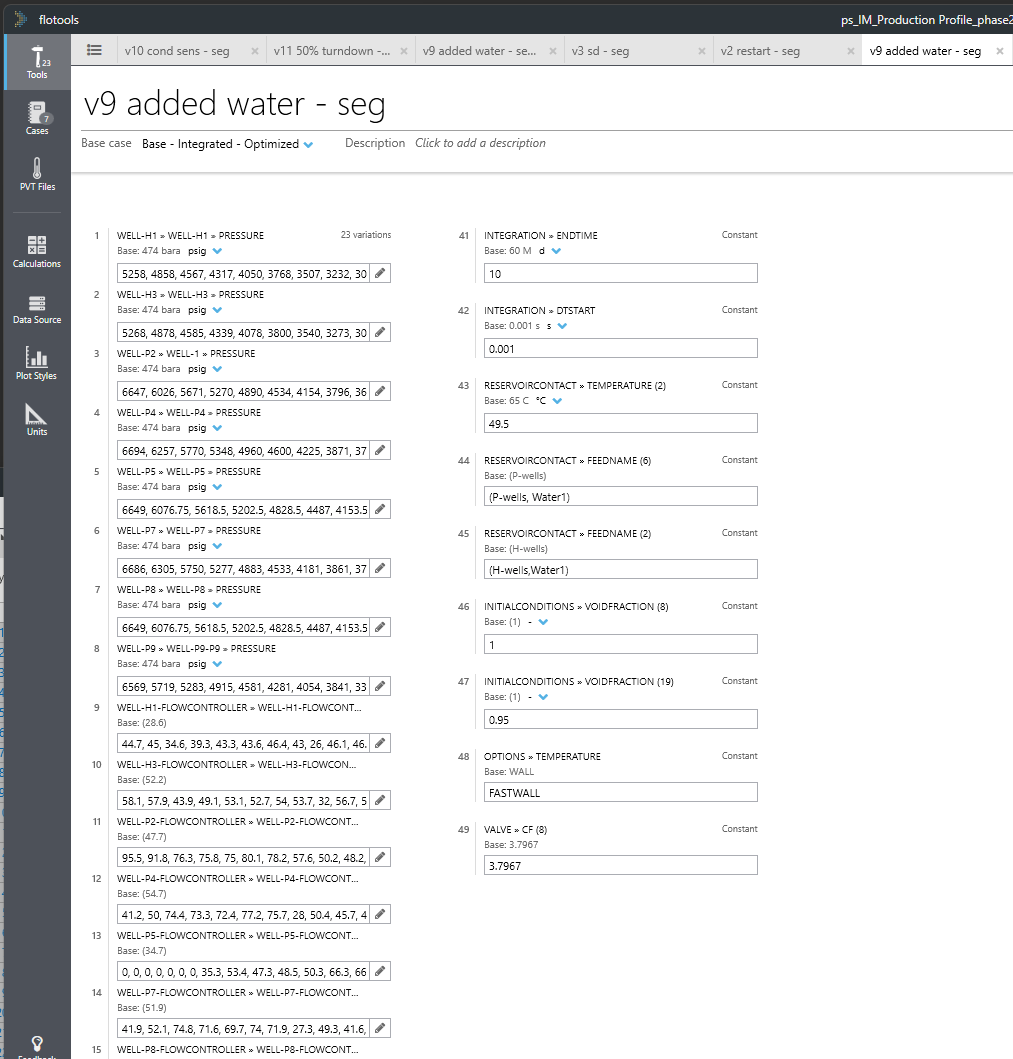
The redesign uses a compact layout for the cards which allows easier visualization of all the variables involved in the parametric study. That said, the example above still has a covariant block with 40 variables that do not all fit on the screen. As a result, the user has to scroll down to see all the variables.
To avoid this, we have introduced a new variable type called “Multiple variables”.
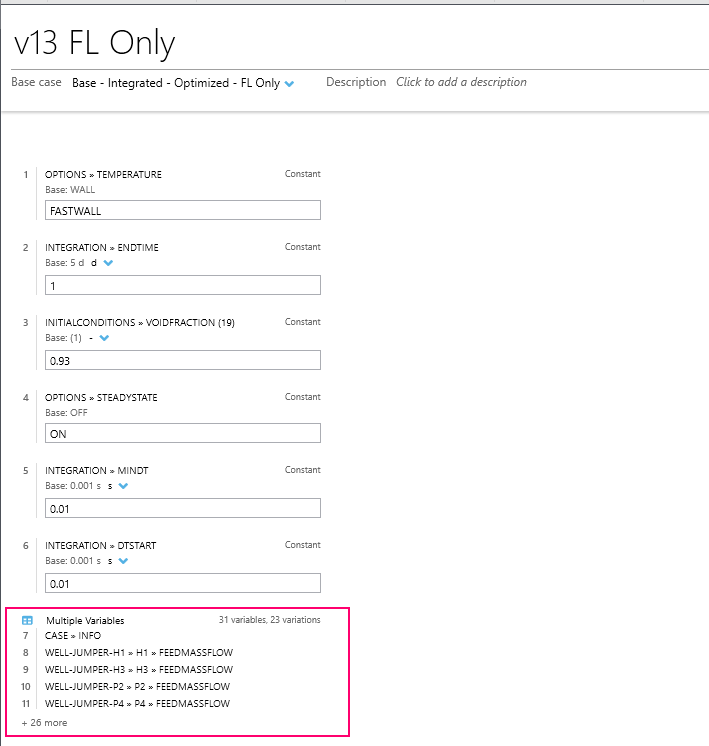
When you add this type of variable, a spreadsheet interface opens up. You can paste in the data from Excel and we have included the ability to parse headers to automatically associate variables and units from the headers.
More details on the format of the headers can be found by clicking the Help link at the bottom of the tool.
Once you have setup your parametric study, you can preview the changes that will be made to the base case for each variation by clicking the new Preview button next to the “Generate Cases” button.
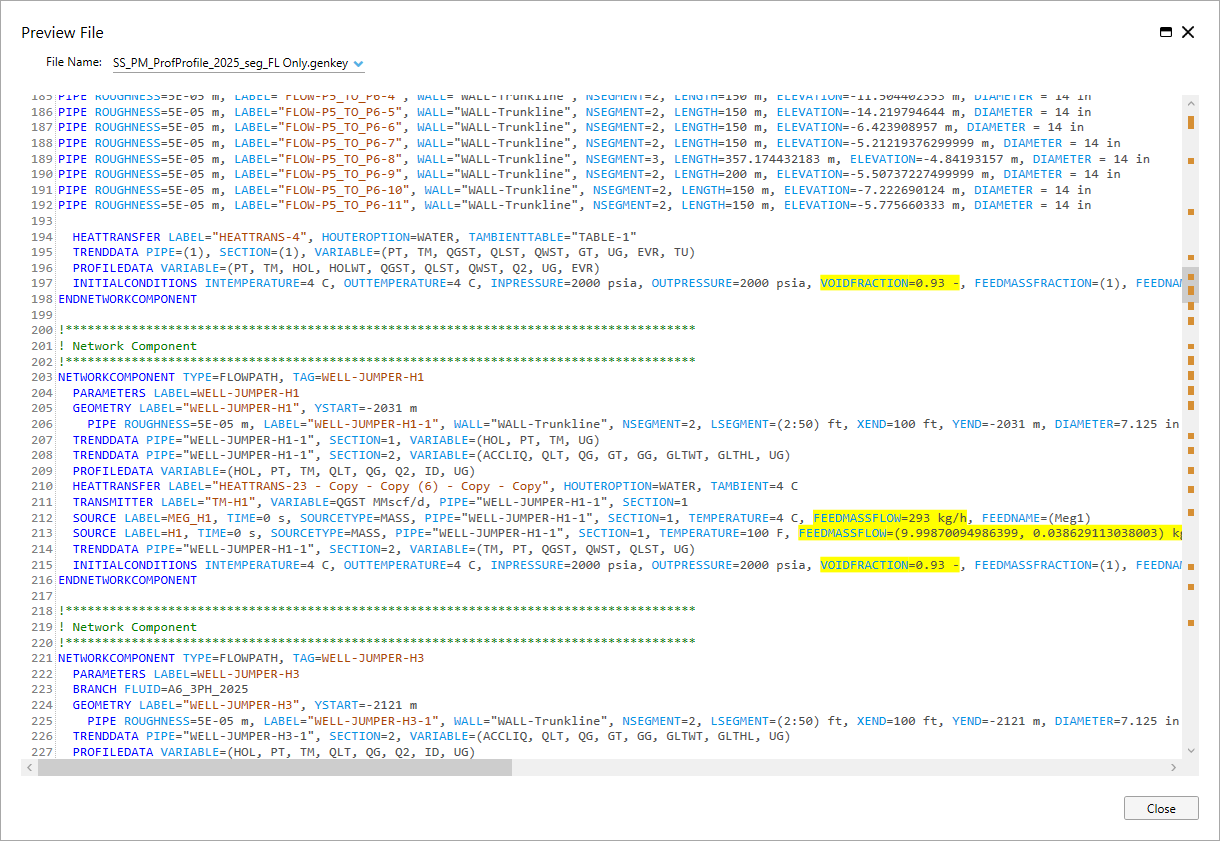
The file preview opens up to a familiar interface (for those who also use flowpad) and shows the changes highlighted both in the text window as well as in the scrollbar.
These are just the major enhancements in this release. There are many more minor usability improvements, features, and bug fixes that make this one of the most feature-rich releases in the history of flotools updates. We’ve already started working on flotools 2.5, so chime in with your feedback so we can incorporate the features you want in the next release!