
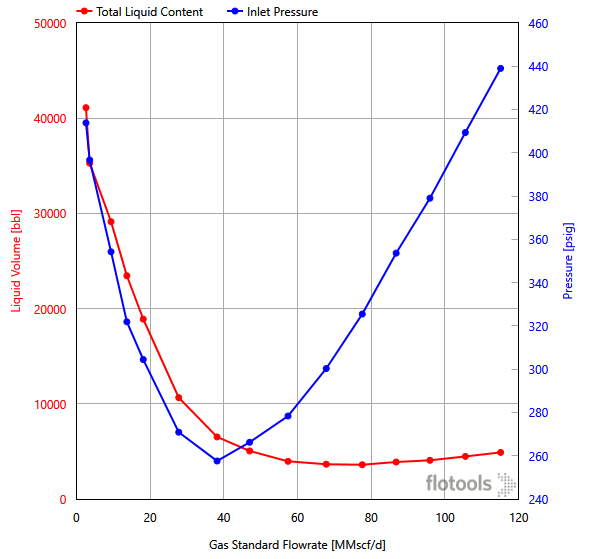
Flotools has added the option to have multiple Y variables when plotting parametric plots in the 2.3 release. This feature gives new flexibility in how one can visualize results, especially when comparing the effects of independent variables on multiple calculated variables over a wide range of cases. An example of a typical use case for this feature is with liquid loading and turndown curves in a gas pipeline:
Adding a new Y variable to an existing parametric plot is simple; all that is required is a parametric plot to be created previously. In flotools 2.3, a new button appears on the parametric plotting page here:
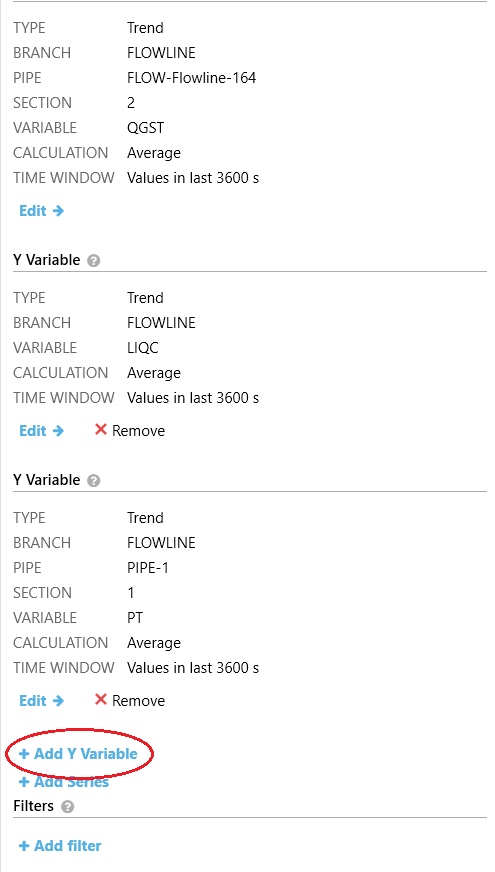
The process of adding a new variable is the same as selecting an X or Y variable in a parametric plot.
When multiple Y variables are added to a parametric plot, the assignment of variables to different axes follows the same principle as a regular trend or profile plot in flotools − if the units for variables are the same, those variables will be assigned to the same axis, and if the units are different, new axes will be created. When a second Y-axis is added, it will show on the right hand side of the parametric plot.
PRO-TIP: You can use the new Stack Plot feature with the parametric plots. Just head over to the Series panel and click the “STACK PLOT” checkbox and flotools will separate the parametric series into separate plots grouped by the axis type!
Even when multiple Y-variables are added, there is still an option to partition the points in each variable using a series variable (typically an input variable that was varied in the parametric study). However, you can only choose one series variable to partition the data and that is applied to all the Y variables.