

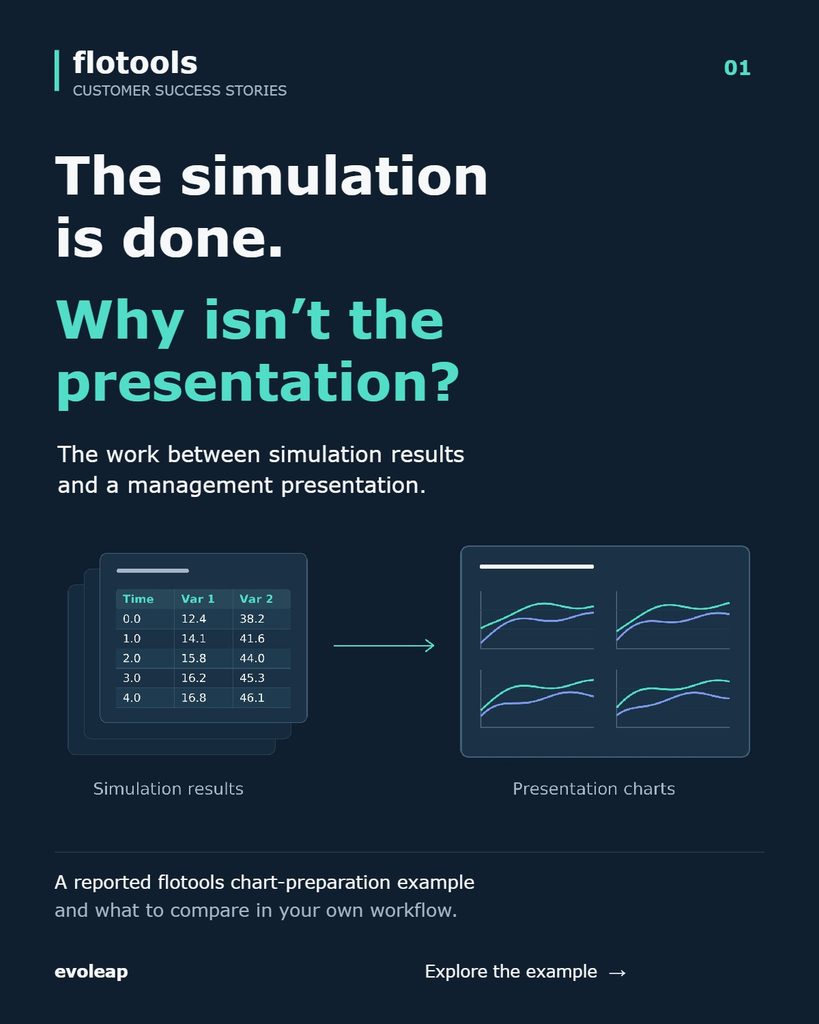
The simulation is done. Why isn’t the presentation? For many flow assurance teams, the work between simulation results and a management presentation still takes days. This customer story looks at where that time goes through a head-to-head comparison of creating 16-charts for a management presentation, with and without flotools.

This example came from an ROI discussion in one of our Customer Success Program interviews. The customer reported one engineer producing 16 charts for a management presentation in under 30 minutes. With an in-house tool, manual formatting and QA, the same task had taken 1–2 days.
Results like this feed evoleap’s formal Customer Success Program and ROI processes. Prospects use it to build a business case, and existing customers use it to quantify the value they gain after adoption. Our regular cadence of touchpoints brings the voice of the customer into product planning and confirms that each team is realizing the value it expected.
In this flotools customer story
- Where chart-preparation time goes: choosing results, making charts consistent, assembling the presentation and handling revisions
- A simple way to compare one of your own reporting tasks, while keeping the engineering checks in place
- Where chart preparation fits in the wider flotools workflow, from data gathering to reporting
Want the bigger picture? See the Flow Assurance Software Suite ROI Guide, or learn more about flotools.