
This blog post will describe how flotools’ calculation feature was used to calculate the hydrate formation temperature as a function of time and location for a methanol-inhibited system during a cold-well start up. The analysis demonstrated that a less conservative use of hydrate inhibitor was acceptable. The well and flowline were successfully started up based on this analysis. This example is an advanced use of the flotool calculation feature.
The scenario is a well and flowline where the well is initially shut-in; the flowline is filled with a seawater/methanol mixture (15% methanol by volume); and a methanol pill has been placed just downstream of the wellhead choke. The choke will be opened, and the hydrocarbons will push the methanol pill and methanol-seawater mixture out of the flowline. Unfortunately, due to the pipeline profile and the different densities of the hydrocarbon liquid, gas, and aqueous phases, the displacement of the methanol-seawater mixture will not be clean. The hydrocarbons can potentially flow past the methanol pill, contact the methanol-seawater mixture, and form hydrates if the temperature/pressures conditions are suitable.
The goals are to ensure that the flowline will not be susceptible to hydrate formation conditions at any point in time or location during the startup sequence and to minimize the size of the methanol pill. This analysis is a combination of 6 calculations: 5 simple ones, and a final complicated calculation that does the heavy lifting.
First, let us go through the supplementary calculations:
- The first calculation calculates the water volume in each pipe section. (The density must be calculated instead of using the OLGA water density variable because methanol is considered to be included in the aqueous phase in OLGA)
- The second calculation determines the methanol volume in each pipe section.
- The third calculation uses the two previous calculations to determine the percent methanol in the water in each pipe section.
Note that the three calculations shown above could be done in a single calculation, but to be able to output the water and methanol volumes separately as their own variable they are required to be standalone calculations.
Then, because hydrates can only form under specific conditions, the fourth calculation checks for:
- The existence of hydrocarbon in each section.
- Whether water is present in each section.
- Whether the methanol concentration in the water is sufficiently high that hydrates cannot form at any practical temperature/pressure conditions in the flowline. This is a user specified threshold that can be manually changed. For this case the threshold is 50% methanol in the aqueous phase.
Now to the fifth calculation, which is the most complicated and calculates the DTHYD variable. DTHYD is a flotools variable and is defined as the ΔT between the fluid temperature and the hydrate formation temperature at the pressure at a given location and time. The most difficult of the calculations so far, this one includes the use of lookup tables, interpolations, and the above calculated variables.
The process order inside the flotools calculation module is shown below:
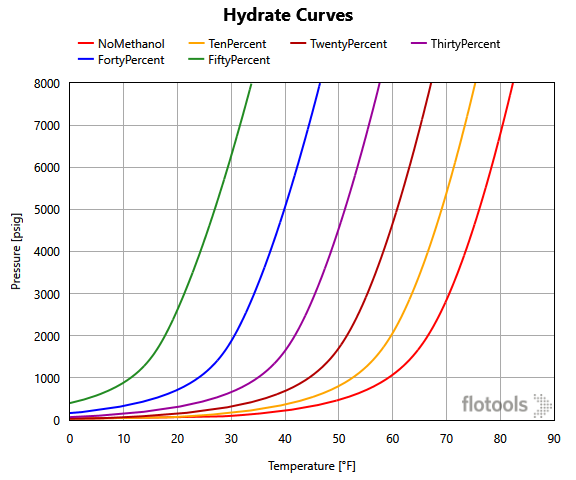
- The hydrate curves for differing levels of methanol are generated from a 3rd party program, in this case MULTIFLASH, and imported into flotools.
- The pressure inside each pipe section is identified.
- The corresponding hydrate formation temperature at the pipe section pressure for each of the hydrate curves, representing different methanol concentration, that have been imported is calculated (6 curves for this example as shown in Figure 1).
- Using the methanol concentration variable already calculated for each section, the two curves that bound the methanol concentration are determined. That is, if the methanol concentration is 22% then the calculation should use the 20% and 30% hydrate curves.
- The final hydrate formation temperature is calculated by interpolating between the values that we looked up in Step 3 for the two bounding curves found in Step 4. This gives the hydrate formation temperature at the specified pressure and methanol concentration.
- Subtract the actual temperature in each section from the interpolated hydrate formation temperature in each section at every time the profile was output.
This fifth calculation would be much simpler if there were only two hydrate formation curves to interpolate between, but because we are using a fine grid for the methanol content, the difficulty comes in determining which two curves to interpolate between in the flotools calculation. The selection of the correct two curves is done by using the methanol concentration calculated in the third calculation and a series of nested IF statements.
The nested IF statements work somewhat like a stepladder, it first checks whether the methanol concentration is above 0% and if so checks if it is above 10%, then 20%…etc. Once the IF statement finds a value that it is not above, it exits the nested IF and declares that that value is the upper bound. i.e., if the actual percent inhibition is 37%, once it realizes that it is not greater than 40% it then decides that 40% is the upper bound of the two curves. To identify the lower bound we first check if the upper bound is greater than 0 and if it is, we subtract 10% from the upper bound to calculate the lower bound. This is easy because the hydrate curves we generated were generated in uniform 10% increments.
If the methanol increments were not uniform another set of nested IF statements would be needed. The IF statements would follow the same stepladder approach but once a value was found to be above the actual methanol concentration, the IF statement would output the previous value, i.e., from our 37% example above, the IF statements would need to output next to the last value as well (i.e., the value before 40% which would be 30%).
The sixth calculation is the final output of the entire analysis. The sixth calculation does a final check to see if all three of the above conditions are met (the conditions in the fourth calculation), and if so, outputs the DTHYD results from the interpolation, otherwise it outputs a null number that can be manually changed (in this case -50).
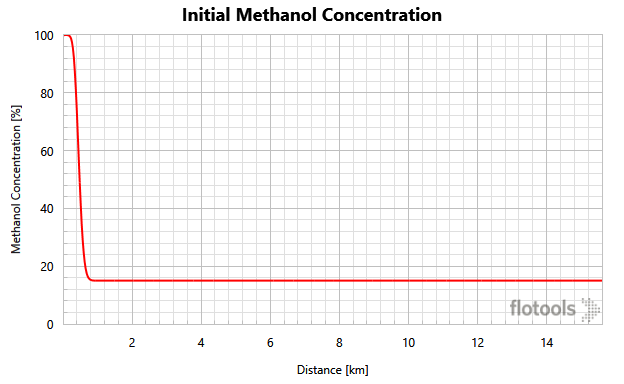
We can see the actual application of the calculation in a case described below. This case has a methanol pill placed at the beginning of a flowline with a well shut in upstream. The rest of the flowline is saturated with a seawater-methanol mixture of 15% methanol by volume (Figure 2).
The well is then opened, and the hydrocarbons begin to push the methanol pill out of the flowline. The methanol pill disperses slightly and some gas that had accumulated at the top of the well during the shut-in squeezes past the methanol pill. The gas has the potential to form hydrates as the three conditions in the fourth calculation are met when gas moves in front of the methanol pill.
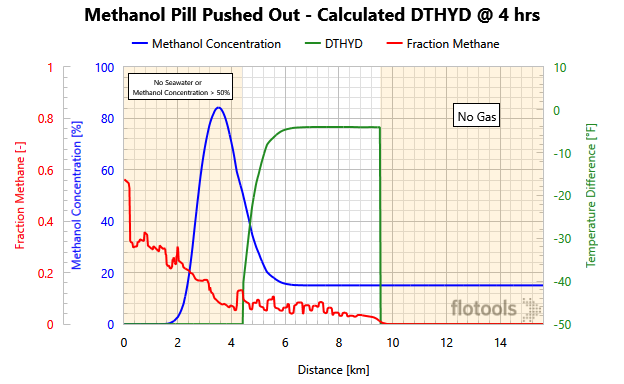
Figure 3 is quite complicated, but it very nicely illustrates exactly where hydrates can form and the ΔT between the fluid temperature and the hydrate formation temperature (Note: when DTHYD > 0 hydrates can form).
- The red curve is the methane fraction as a function of distance. Methane is used as a proxy to determine whether hydrocarbons are present.
- The blue curve is the methanol concentration (volume %) as a function of distance.
- The green curve is DTHYD = fluid temperature minus hydrate formation temperature.
Three distinct regions are evident on Figure 3. Two of the regions are not at risk for hydrate formation. On the right-hand side (shaded) of the graph there is a steep drop-off of the Green DTHYD curve because there are no hydrocarbons in this region as shown by the red, methane-fraction curve.
The left-hand side (shaded) is a trickier region as there are two constraints to hydrate formation:
- Either there is no seawater left (it has all been pushed out)
- Or the hydrocarbon fluid is more than 50% inhibited with methanol (our specified criterion for full hydrate inhibition). Note that on the left-hand side, there could be produced water but for this example the produced water was sufficiently salty to inhibit hydrate formation.
In the middle (unshaded), hydrocarbons are present, and the methanol concentration is below our threshold of 50%. To determine if hydrate formation is possible, we must look at the DTHYD variable. In this region, the maximum value of DTHYD is -4 °F, indicating that hydrate formation is not possible. Therefore, the methanol pill size is acceptable for preventing hydrates.