Presenting results of complex flow assurance scenarios in a single plot can be challenging. Stacked plots are here to help. They can combine multiple plots within a composite image with a common horizontal axis, and are a great alternative to visualize many series of variables while maintaining the plot clarity. They can help to analyze and present complex simulation results more efficiently. Stacked plots can be easily customized and are a great support feature to create high-quality yet simple material for technical presentations.
How to use a stacked plot:
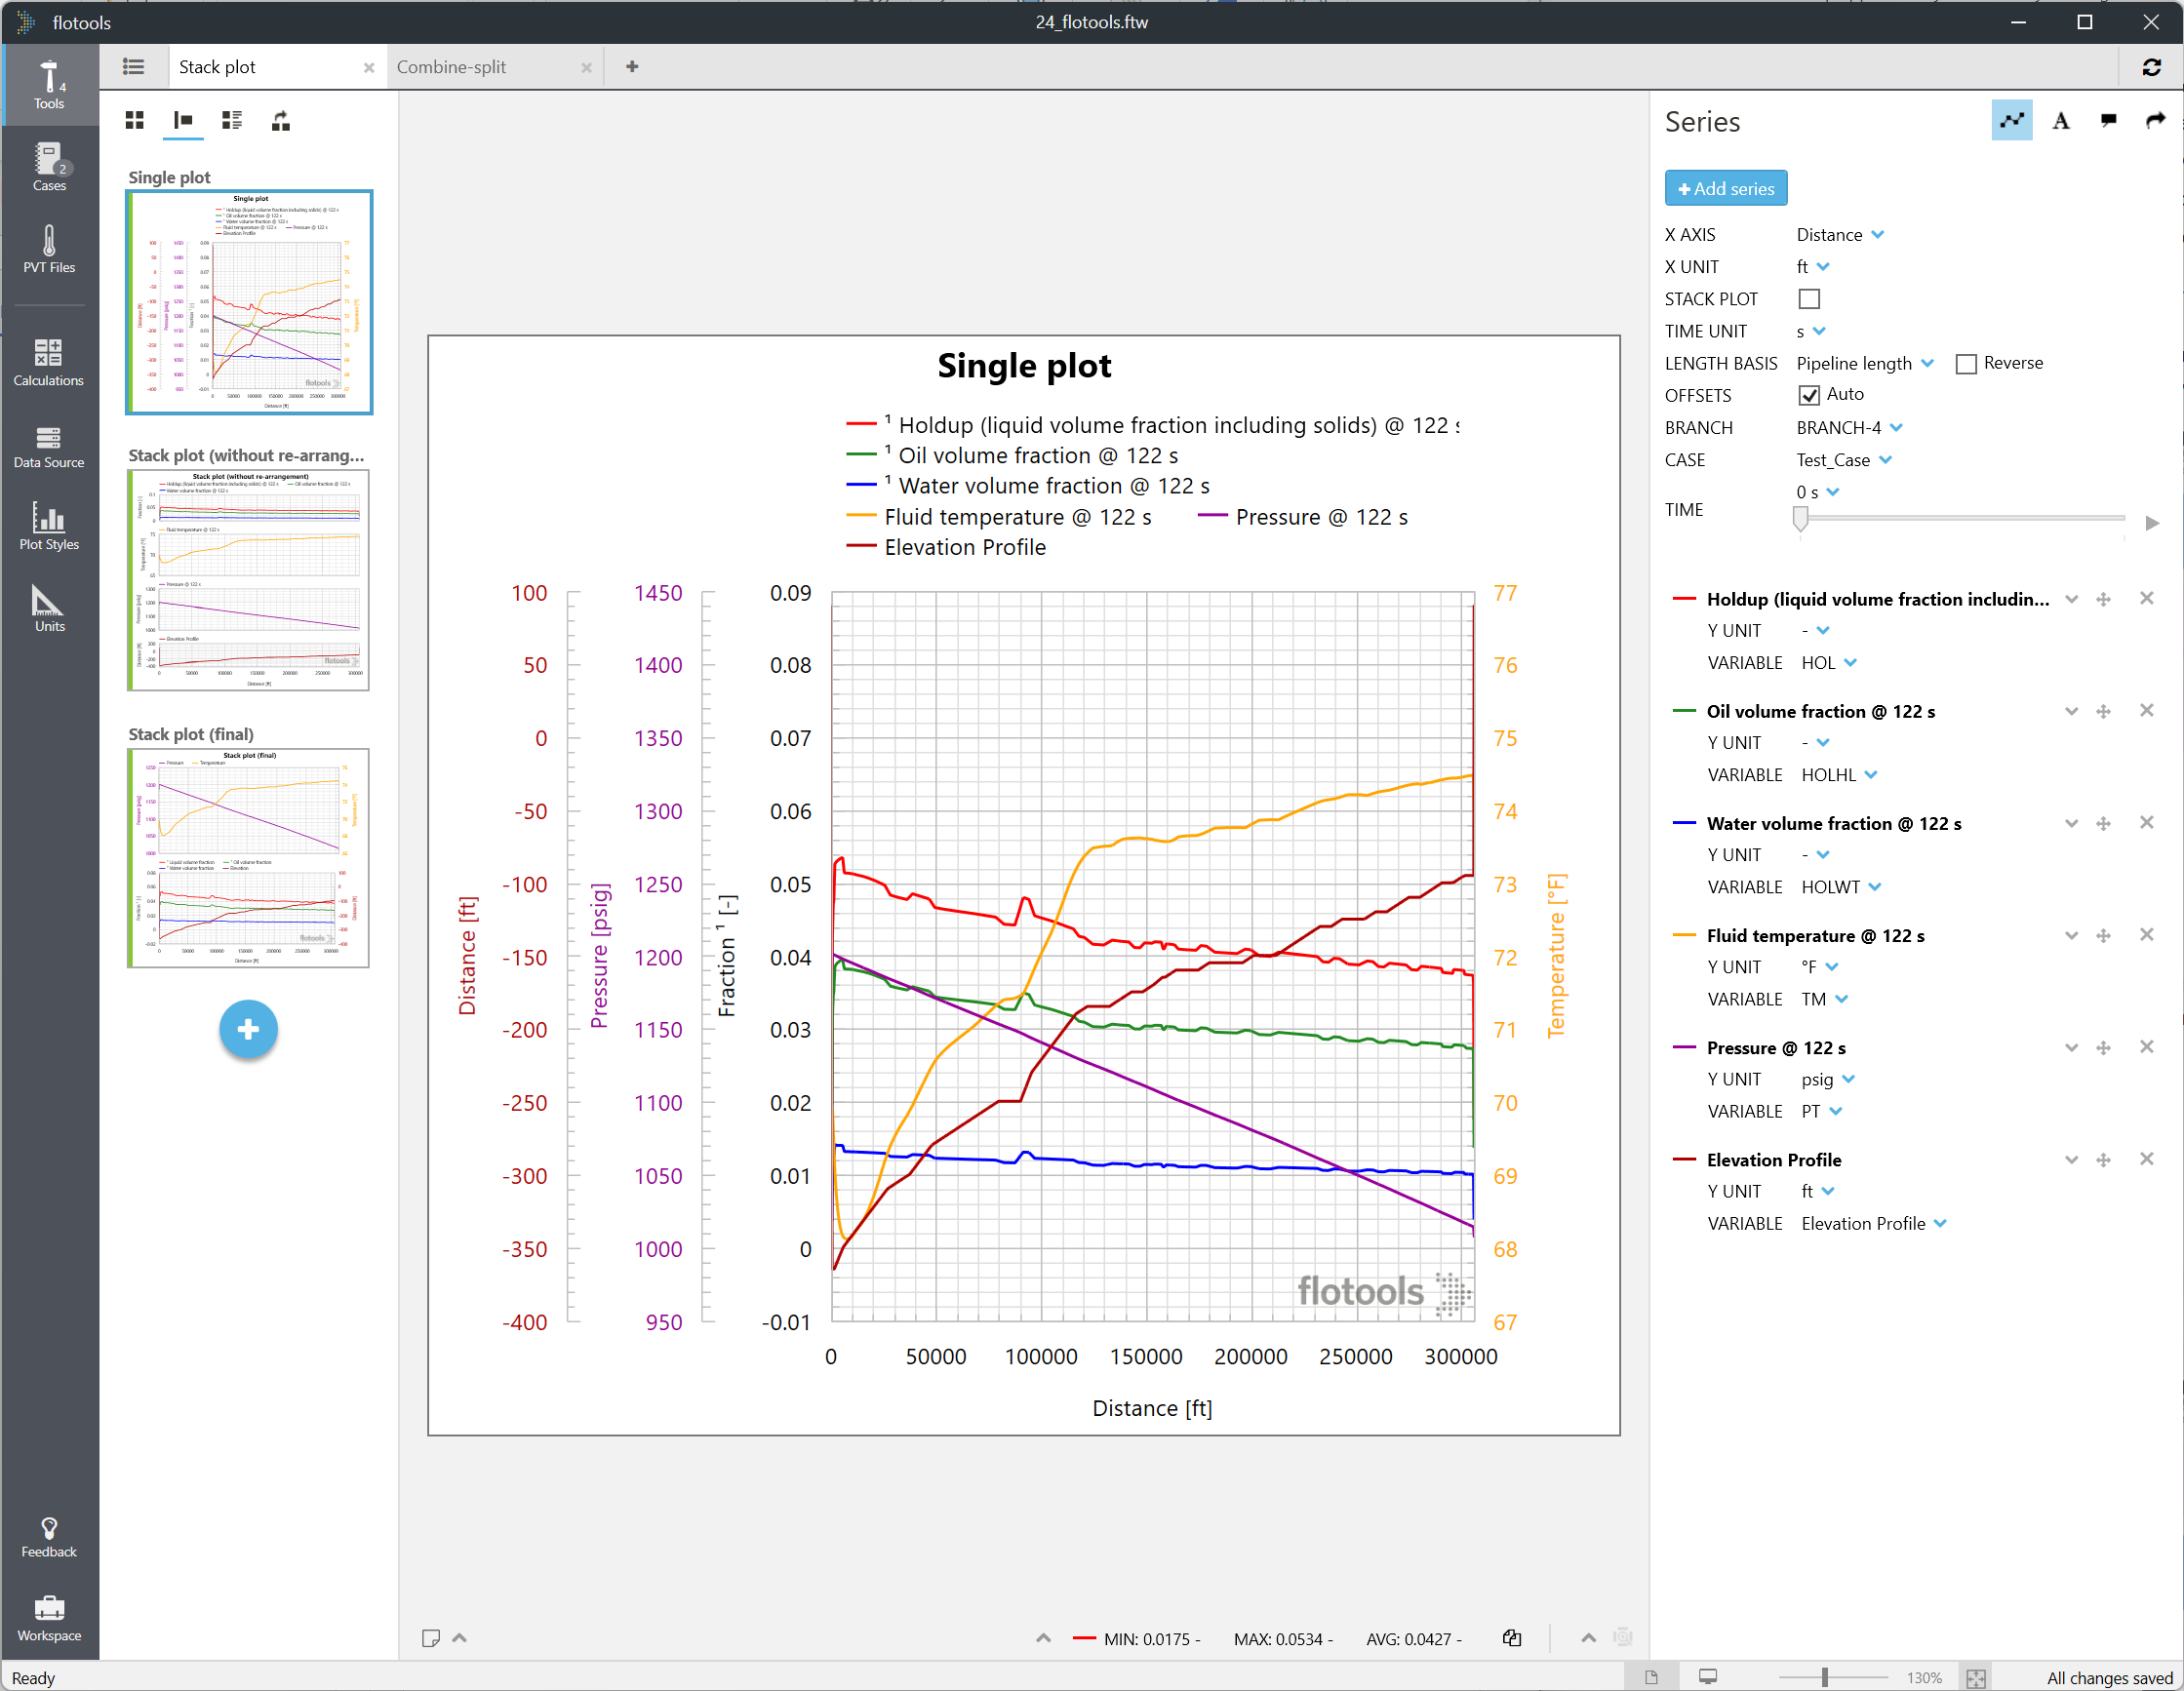
Let’s plot the profiles of gas, oil and water volume fractions, elevation, pressure, and average temperature. In flotools’ previous versions, the user could either plot everything in one single but crowded figure (Figure 1) or use multiple but readable figures.
Let’s use the stacked plot feature:
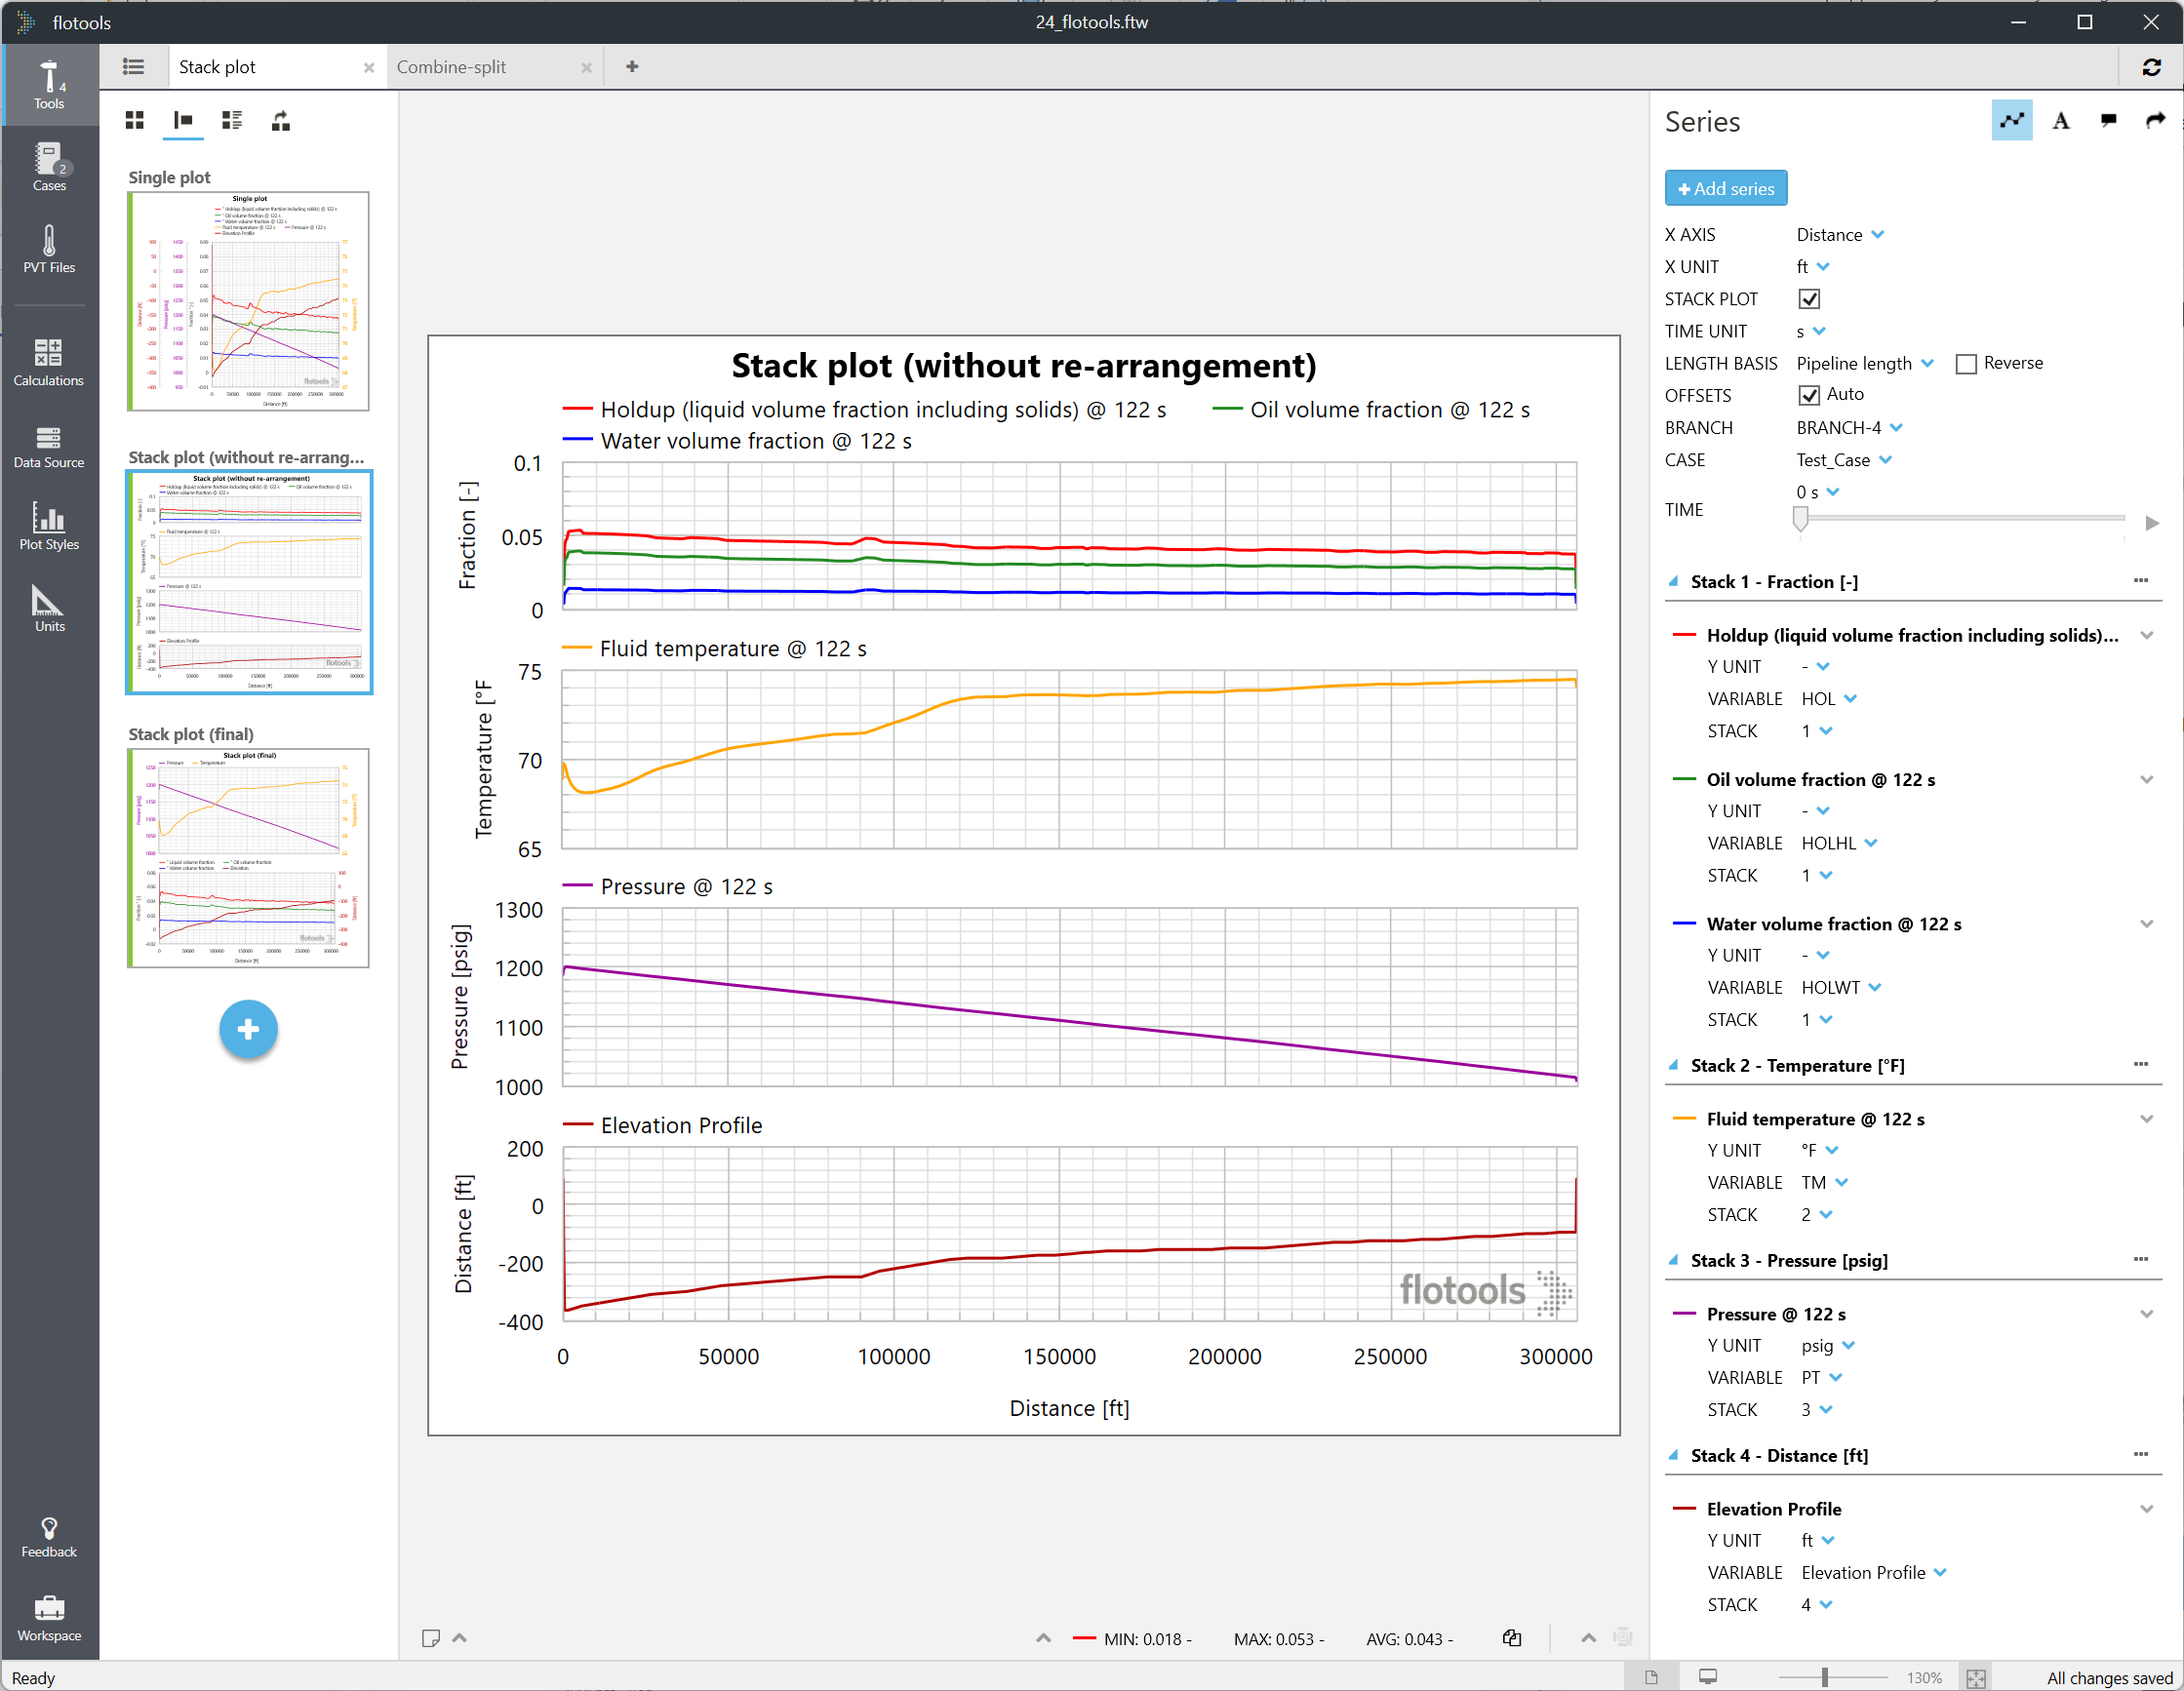
- Select the STACK PLOT check box on the right side of the flotools window (see Figure 2).
- flotools immediately creates a dedicated plot for each variable type (e.g., volume fraction, pressure …).
- Each plotted series contains a new parameter STACK whose value corresponds to the stacked plot position where the series is currently located.
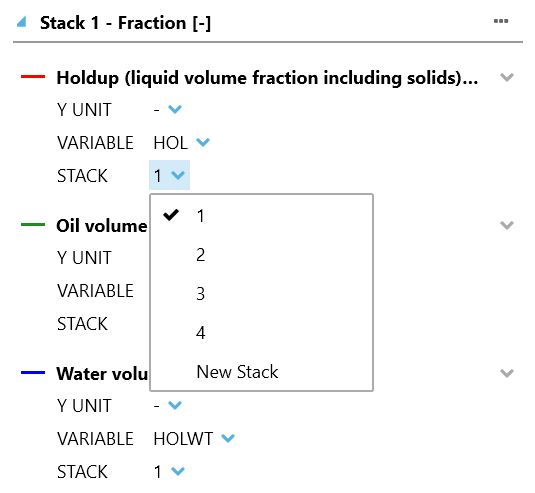
- Rearrange a series by transferring it to another stacked plot or adding it to a new stacked plot using the New Stack option (see Figure 3).
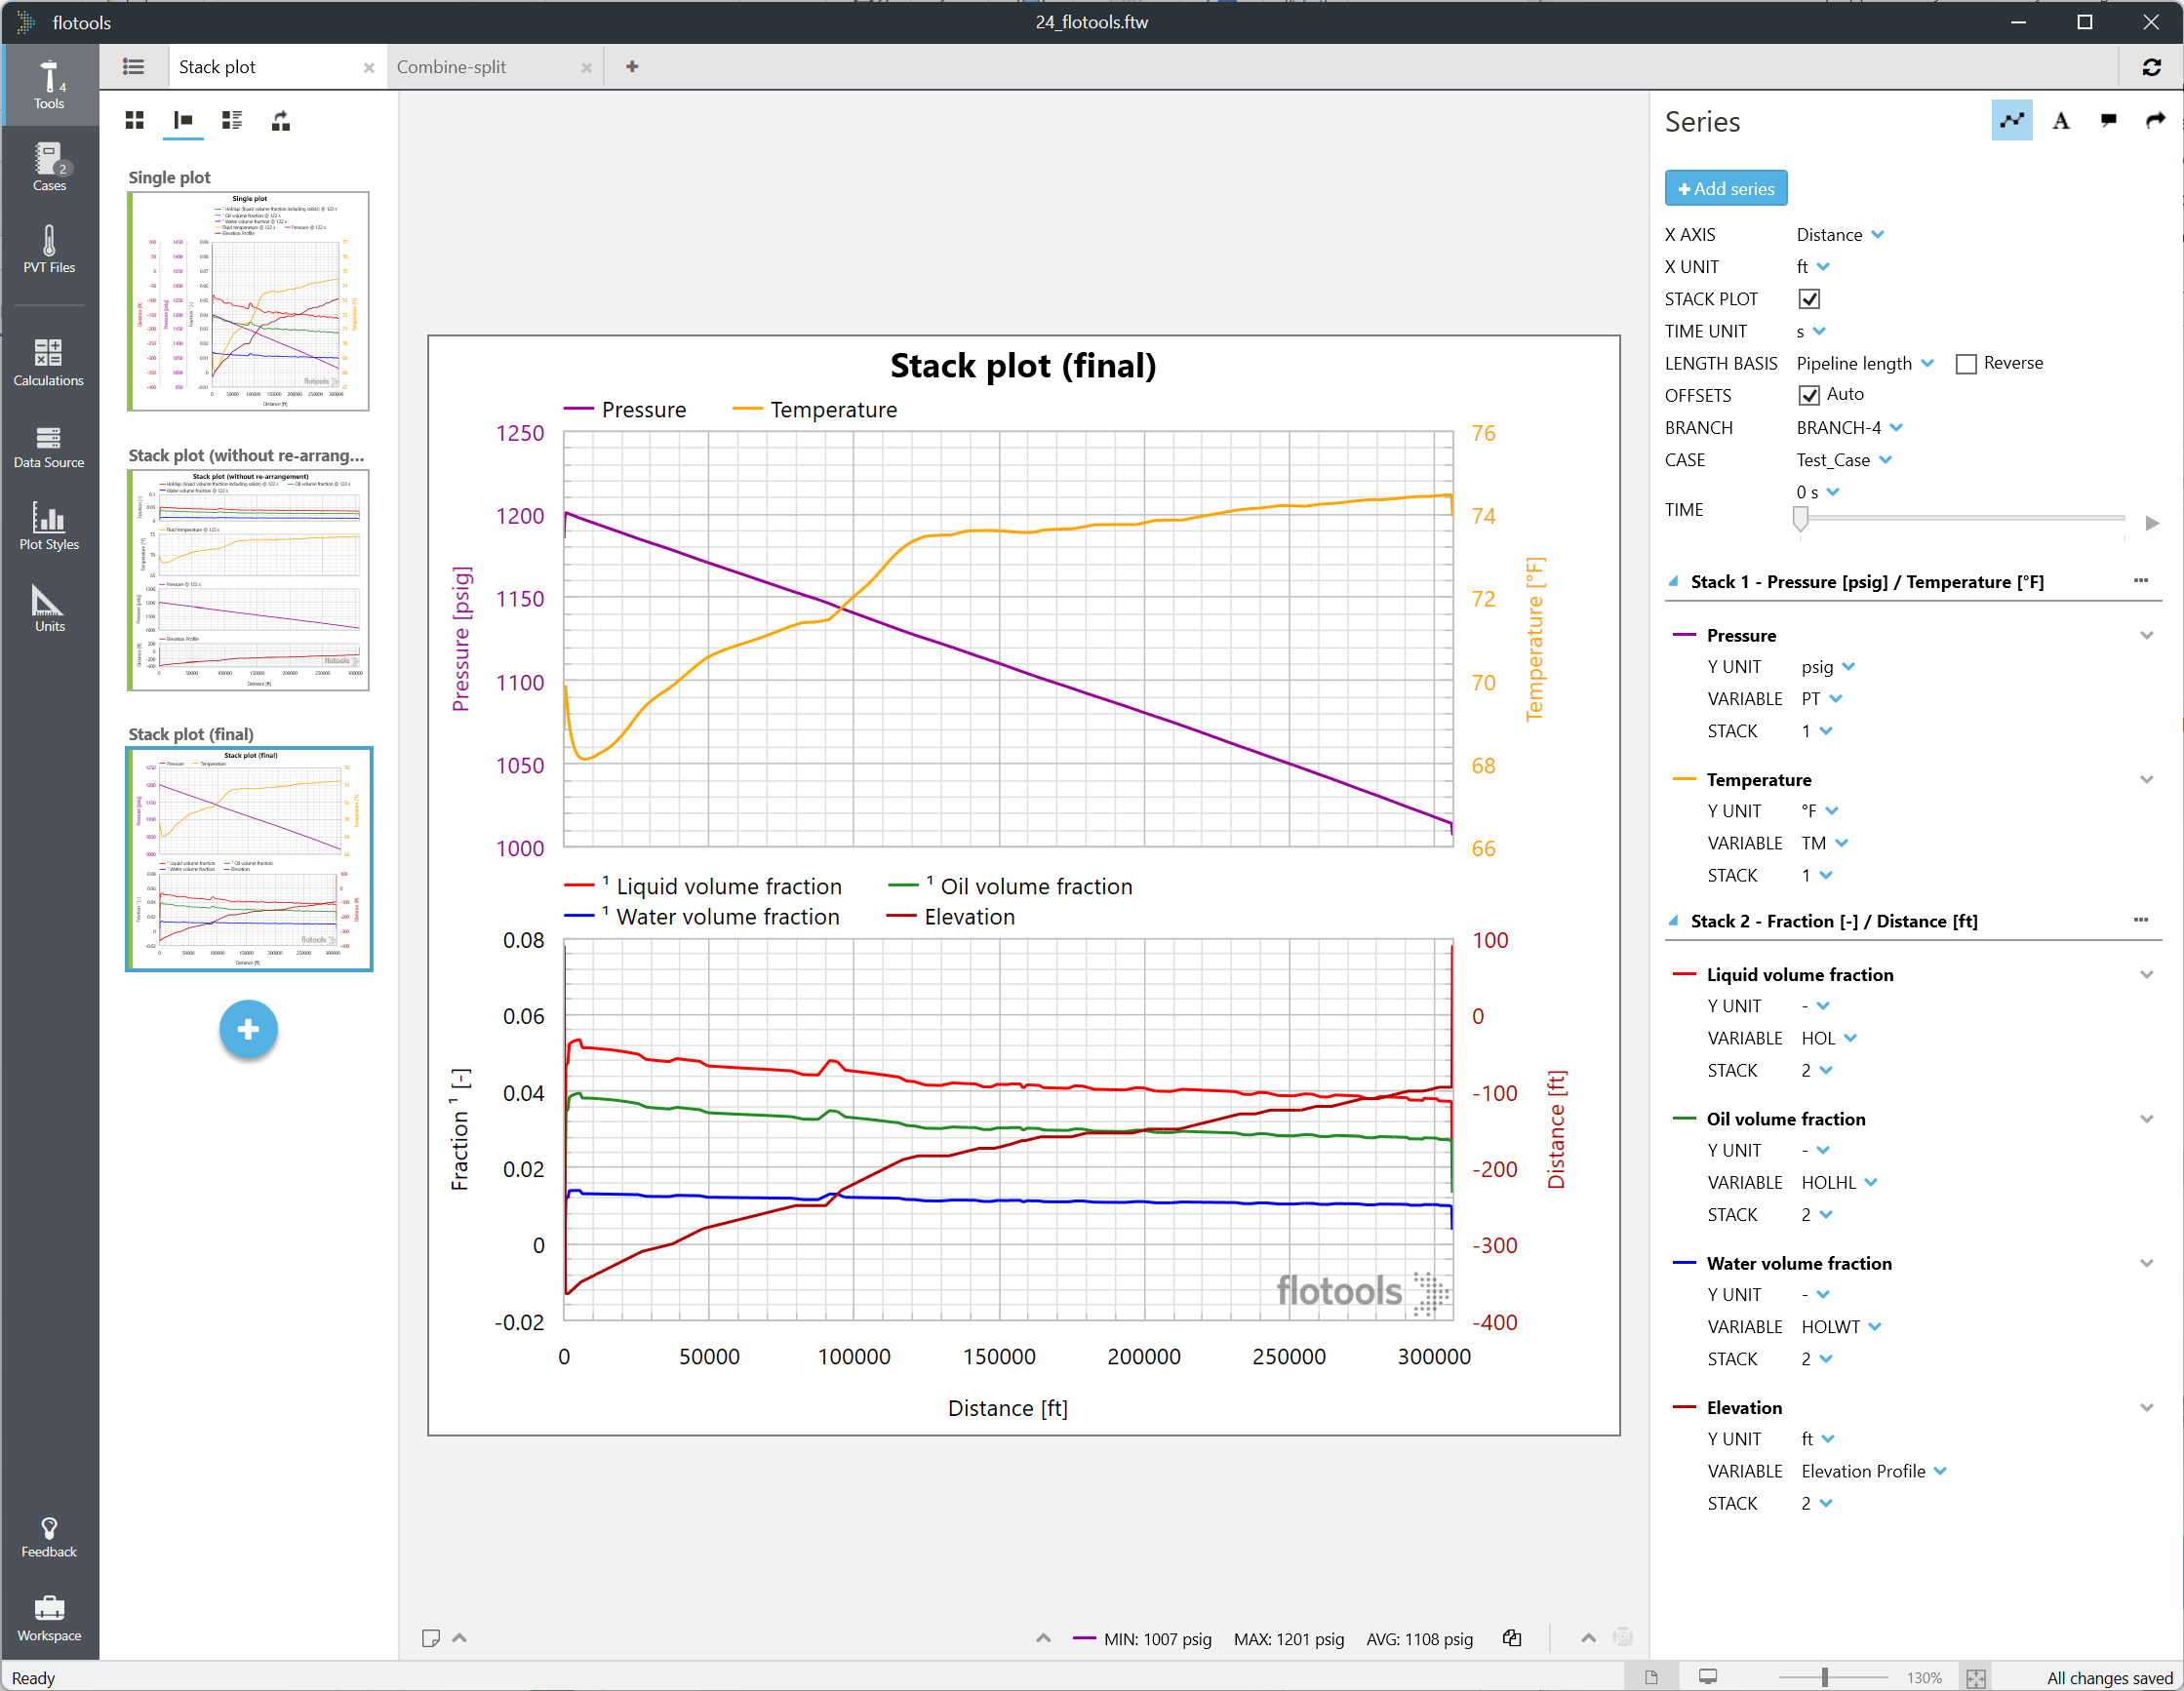
After recombination, the overall plot readability is greatly improved, making it easier to analyze simulation results (Figure 4). Furthermore, the plot may be directly used to create high-quality presentation material.