We are excited to announce the release of flotools 2.2. This release brings operations focused tools and features to flotools.
Supporting operations using flotools
Operations support is a common flow assurance workflow. Whenever we perform simulations in support of O&G operations, we are invariably faced with the task of tuning the model to actual field conditions, which requires us to compare OLGA predicted data against field data.
flotools already supports plotting external data, i.e., data not obtained from OLGA, via the Imported Data tool. The Imported Data tool allows you to copy and paste large amounts of data from Excel; and includes multicolumn data support, automated parsing of series names and units from the headers, and creation of trend and X-Y series from the pasted data.
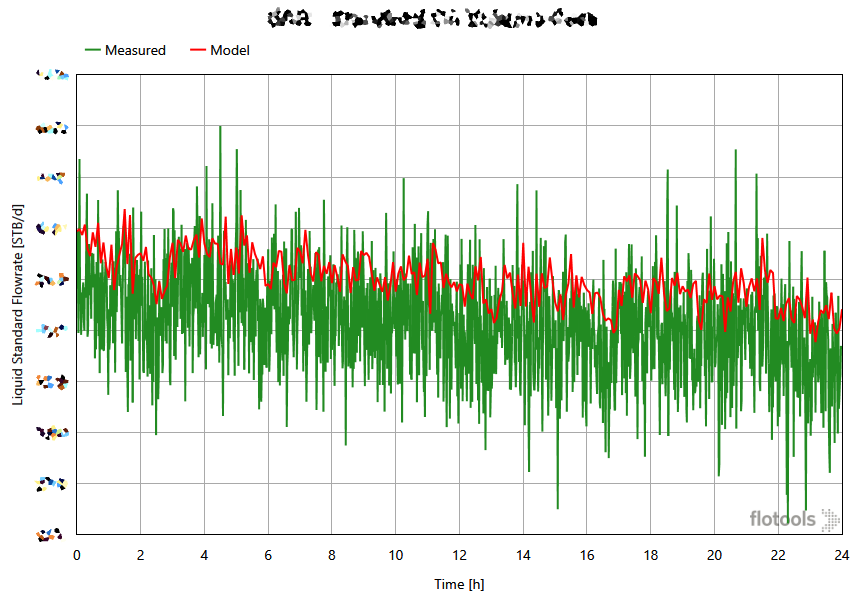
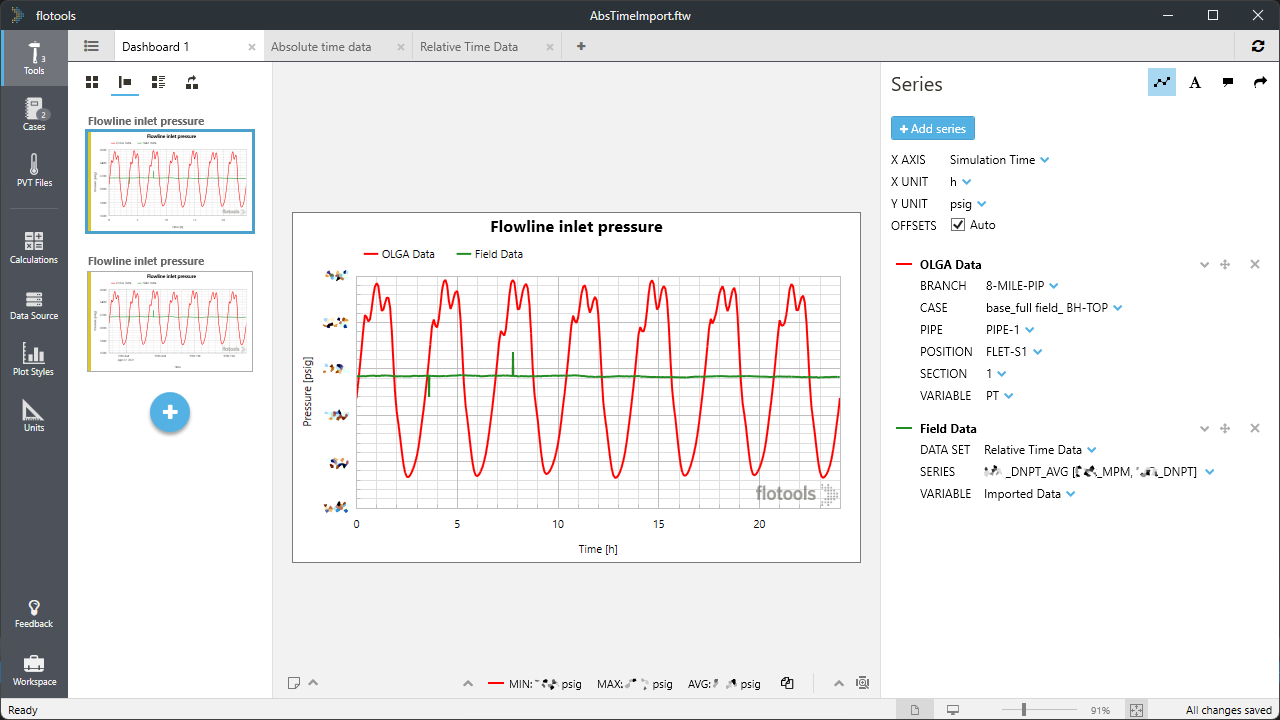
Traditionally, field data were compared to OLGA results by importing field data into Excel by copy-paste, pull in OLGA simulation results for similar boundary conditions to the range of the field data, and then plot field and simulated data on the same axis, as shown in the following figure.
Introducing External Data Sources
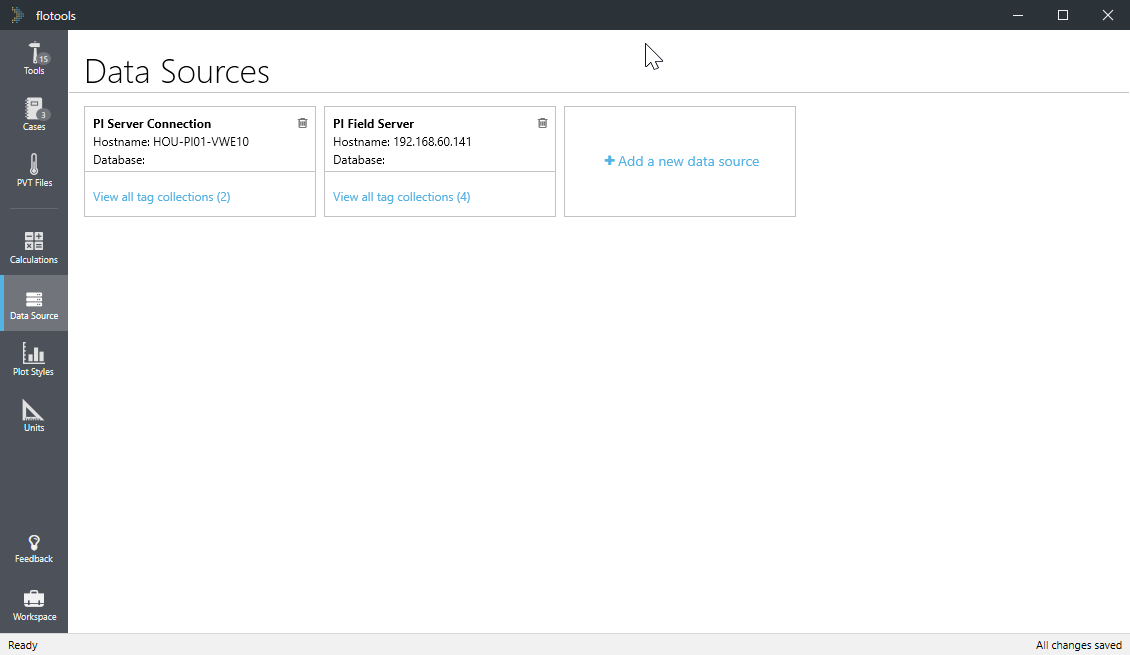
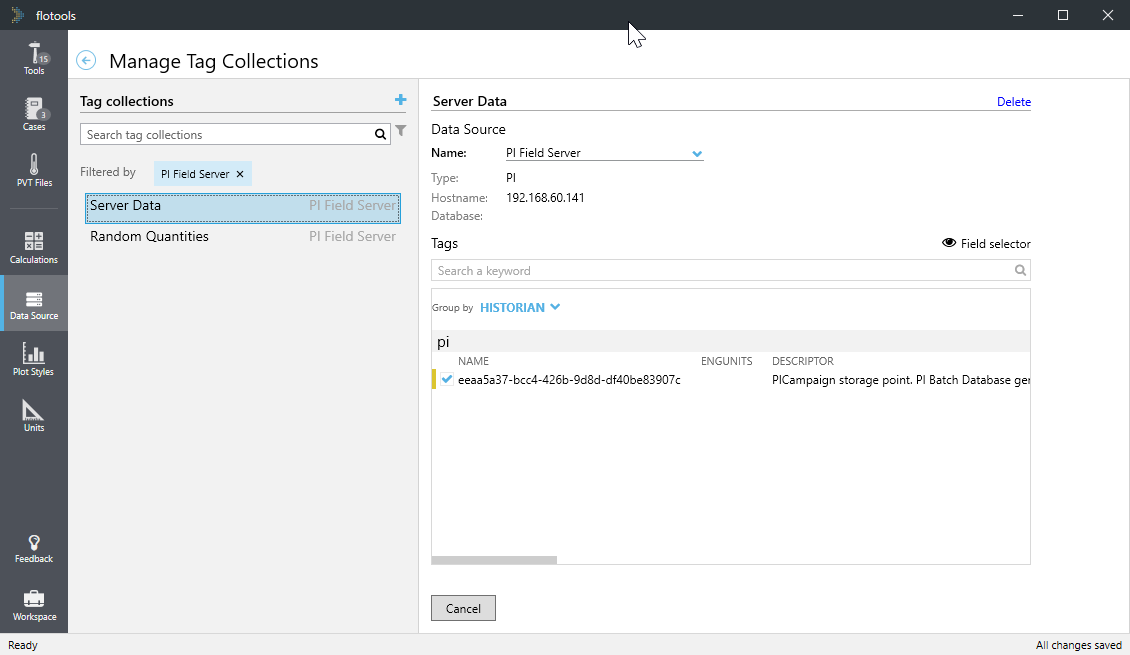
flotools 2.2 eliminates the middle steps by supporting adding external data sources, specifically online historians such as PI, from which data can be imported directly into flotools without having to go through Excel.
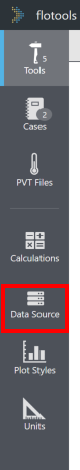
flotools nav menu showing the new Data Source button that allows you to add connection parameters to historian servers
At this time connections to PI historian using the PI Asset Framework SDK are supported. More historian connection types such as OPC HDA will be added in the future.
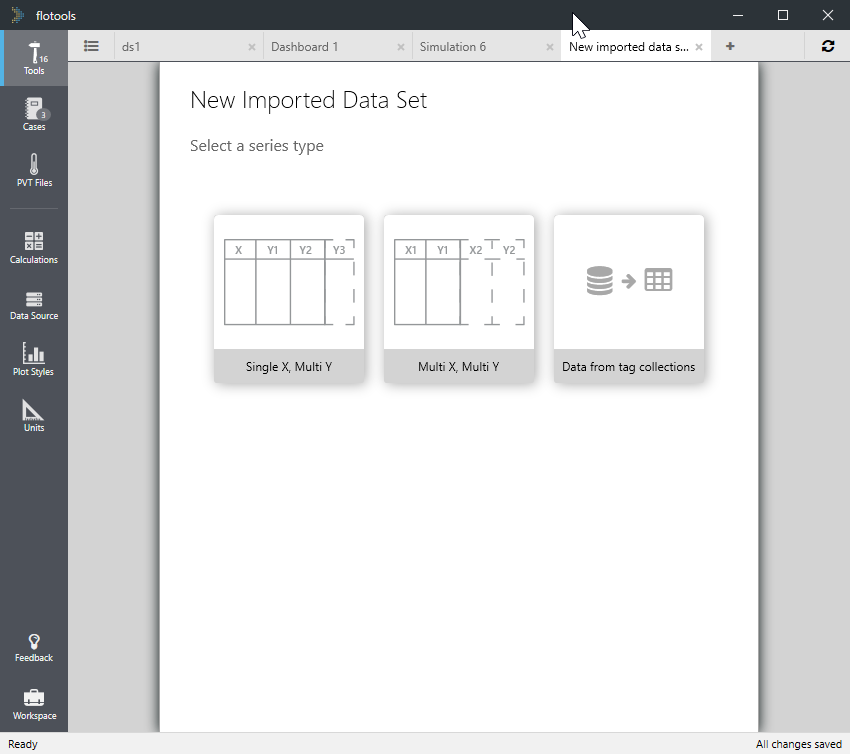
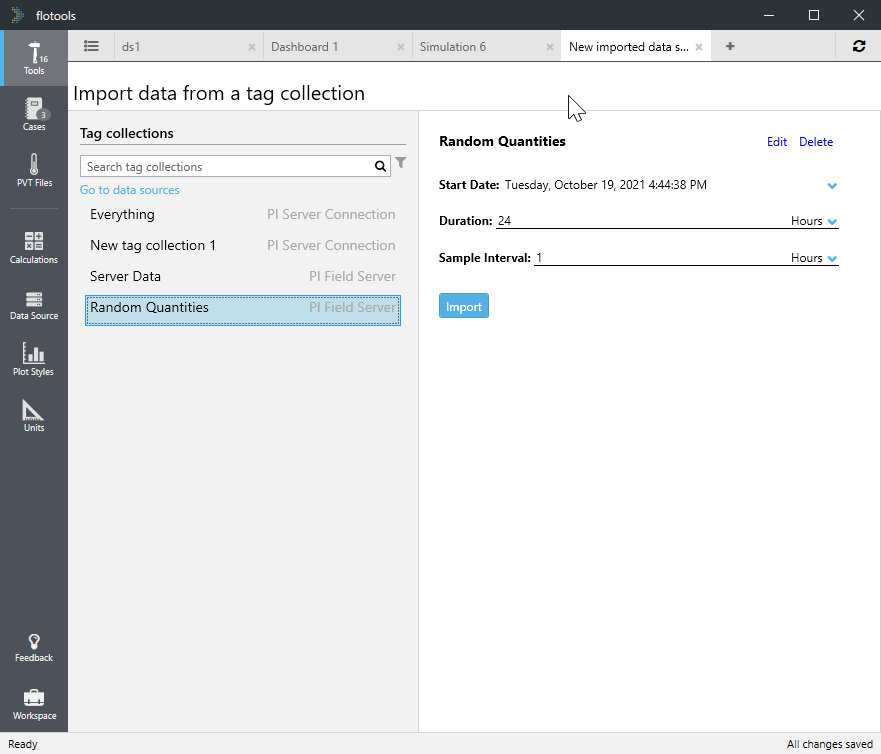
Adding server connections to the Data Source section, enables you to define tag collections to easily import a group of tags.
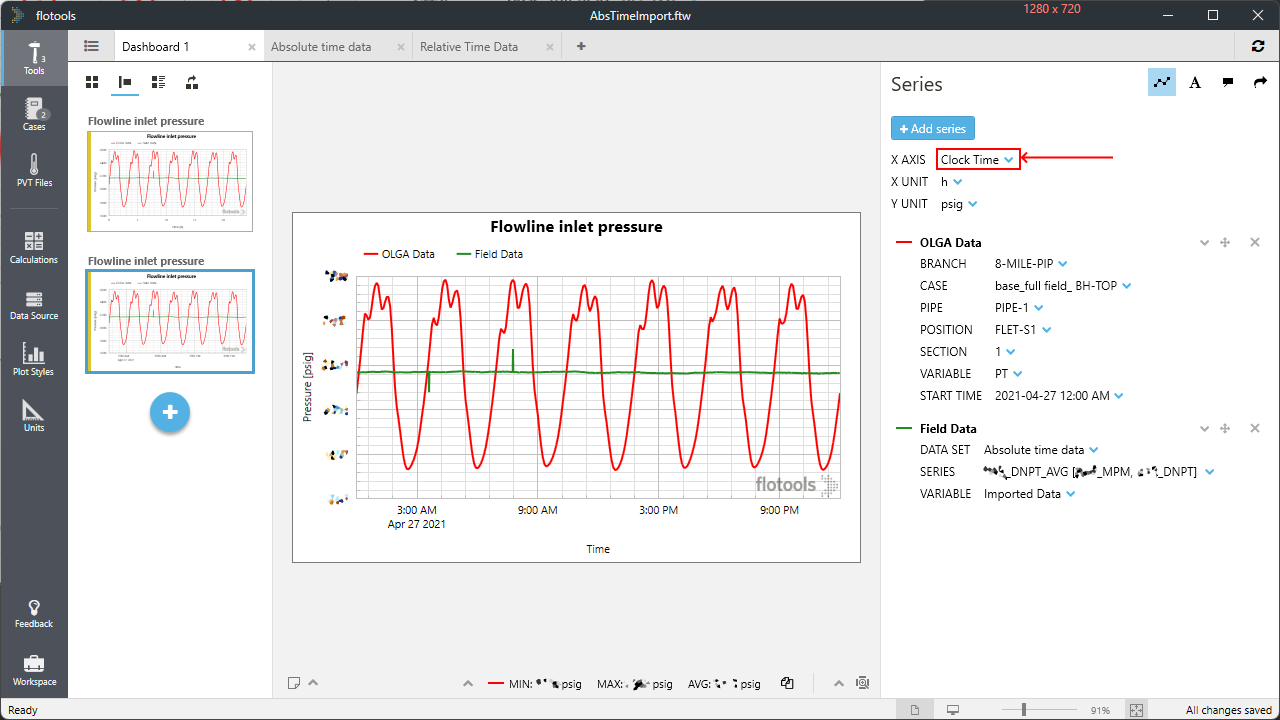
Clock Time Support
flotools 2.2 provides contextual visualization of OLGA simulation results by enabling overlaying of simulation and field data. This is achieved by introducing the notion of clock time for the horizontal (X) axis, instead of using simulation (relative) time. Plots comparing field data to OLGA simulation results can now be presented with the X axis showing the actual date and time of the trend data, rather than as an offset time from the start time of the simulation.
Field Data Simulation tool
flotools 2.2 also contains a new tool called the field data simulation tool. The goal of this tool is to allow you to quickly setup a field data comparison simulation for the purposes of tuning.
Once you have imported field data either from Excel or directly from PI into an Imported Data tool, the Field Data Simulation tool allows you to pick a base OLGA file and substitute data series from the imported data tool into OLGA input keys. For example, outlet pressures, inlet source flow rates, water cuts, GORs, etc. can be mapped directly from imported data series into the input file to create a new input file that represents the conditions of the field.
Once you have created the input file and run it, the results can be pulled in and predicted conditions such as inlet pressures and outlet temperatures can be compared directly to other tags in the imported data set that weren’t used as boundary conditions.
Design Basis Report tool
Finally, flotools 2.2 includes a tool to summarize the design parameters used for simulation cases in nicely formatted tables that can be copied into your flow assurance reports. Once you select a case, you can map the various flow paths in the input file to different systems (production, injection, export, etc.) and select the type of flow path they represent (rigid/flexible flowlines, wellbores, etc.). Depending on the type of flow path, different data tables are generated, and the flow paths are grouped by the system they belong to.
Each of the tables can be copied to the clipboard at the click of a button to be easily imported into Excel or Word.
You can find more information about how to use this tool here.